Part 2: Novel Techniques to Prioritize Technical Debt

In this part of the Software (r)Evolution series we’ll expand the concept of Hotspots into a more general tool. A tool that lets us reason about both architectural problems, but also dig deep into our code and get specific recommendations on how to refactor and re-structure code in order to simplify its maintenance.
We’ll put the techniques to work in a case study of a well-known codebase and make decisions influenced by data. You’ll see how we identify a small section of code, just 180 lines, as a specific target for improvements. You’ll also learn how we can be pretty confident that an improvement to those 180 lines will yield real productivity and quality gains for you. So please follow along as we dive deeper into how code evolves and explore a technique with the potential to change how we approach legacy code.
How Much Technical Debt is Enough?
The technical debt metaphor has taken the software world with storm. Like so many other ideas, the moment it hits mainstream, its meaning morphs into something more fuzzy and vague. Today, the technical debt term is often used to describe any kind of code that either:
- lacks in quality, or
- represents code we didn’t write ourselves.
This use of the technical debt term is far removed from it’s original meaning. Sure, it’s good that our industry has started to pay attention to the cost of bad code. But trying to quantify technical debt from code alone is a dead end. Let me elaborate by sharing a story.
I analyze a lot of different codebases for Empear. That is, I go to a customer site, analyze their codebase, interview the developers and managers, and provide specific recommendations on how to improve the quality of the system, which includes the development organization. More often than not, the organizations I visit already use some kind of automated tools for code quality. For example, last year I visited an organization that used a tool that promises to quantify the technical debt in any codebase. As they run that tool on their 15 years old system, the tool happily reports that this codebase has accumulated 4.000 years (!) of technical debt.

4.000 years of technical debt in perspective.
Now, 4.000 years of technical debt may well be an accurate estimate. However, that doesn’t mean it’s particularly useful. Given 4.000 years of technical debt, where do you start if you want to pay it back? Will you ever get there? What’s the interest rate? And does it all really matter?
Fortunately, there are some good news in this situation: most code isn’t as important as we’d like to think. Let’s see why.
Most of your Code isn’t Important
In our previous part of the Software (r)Evolution series we learned that changes to a codebase are unevenly distributed. We saw that most of our development activity is located to a small part of the total code and that the majority of all files are rarely, if ever, touched.
This finding has important implications because it means that all of your technical debt doesn’t matter. You can ignore most of those 4.000 years of potential technical debt and focus on the parts that really matter for your ability to maintain the system. And with techniques from software evolutionary research we’ll have that code narrowed down in just a few minutes. Let’s see how it works.
Hotspots all the way down
In the previous part we learned to prioritize improvements using a Hotspot analysis. Hotspots are complicated code that we have to work with often. You see an example of a Hotspot analysis in the following picture; The red circles represent Hotspots.
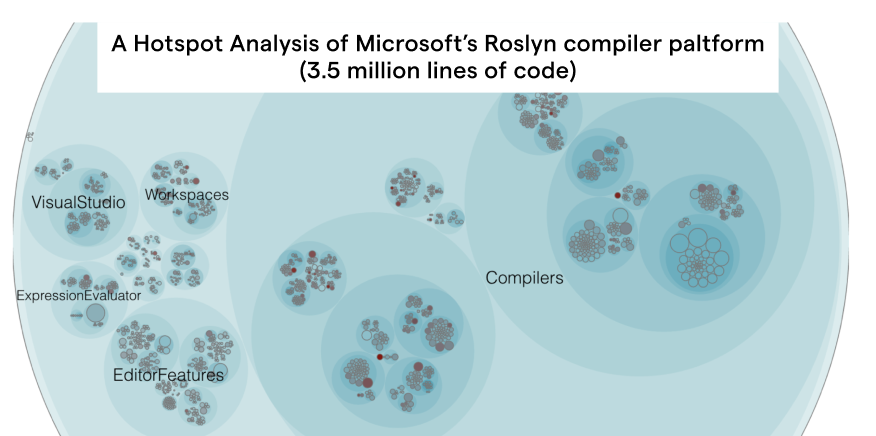
An example on a Hotspot analysis of a large polyglot codebase (3.5 Million Lines of Code).
In a Hotspot analysis we go beyond the current structure of the code and look at how the system evolves. We basically add a time dimension to our view of the codebase. That time dimension is fundamental to understanding large-scale systems. I’m going to go out on a limb here and claim that, by default, we really shouldn’t care if some code is badly written or contains excess accidental complexity. As we’ve seen in part 1 , in most cases it doesn’t really matter. Low quality code only matters if we need to work with it, perhaps to fix a bug or extend an existing feature. But of course, then it becomes a true nightmare.
The reason that many well-known speakers and authors in the software industry seem obsessed with keeping all code nice and clean is because we cannot know up front in which category code will fall; Is it code that ends up in the long tail that we rarely touch or will we have to modify that piece of code on a regular basis?
Hotspots are great because they help us make this divide between the code that matters, the one we need to simplify and improve, and the code whose quality is less important as long as the code does its job.
So far we’ve only seen Hotspots on a file level. But the concept of Hotspots is much more general. So let’s apply the Hotspot concept to architectural components.
Identify architectural hotspots
By now I’ve made a number of bold claims and some of you probably branded me as a heretic the moment I said that low-quality code isn’t necessarily a problem. Because I really like to get my point across - these techniques have the potential to change how we view software - I will get specific by studying a real-world system. As a tribute to my old life as a .Net consultant, we’ll use Microsoft’s ASP.NET MVC for our case study. You can follow along in the online analysis of the project. Just click to start the demo and you should see the same data as we cover next.
ASP.NET MVC is a framework for building dynamic web sites. Our first step here is to define our architectural boundaries. This is something you do once in the CodeScene Enterprise Edition using a simple pattern language. I won’t bother you with the details, but just to give some examples, we define the view engine Razor as one component, the tag helpers collection used to generate HTML elements as another component, and so on. We also make sure to include the different test code folders as architectural components. This is important because automated tests exercise significant influence on the design of a system.
Once you’ve defined your components, CodeScene will run a number of analyses on architectural level. Here’s what the architectural Hotspot analysis looks like on ASP.NET MVC:
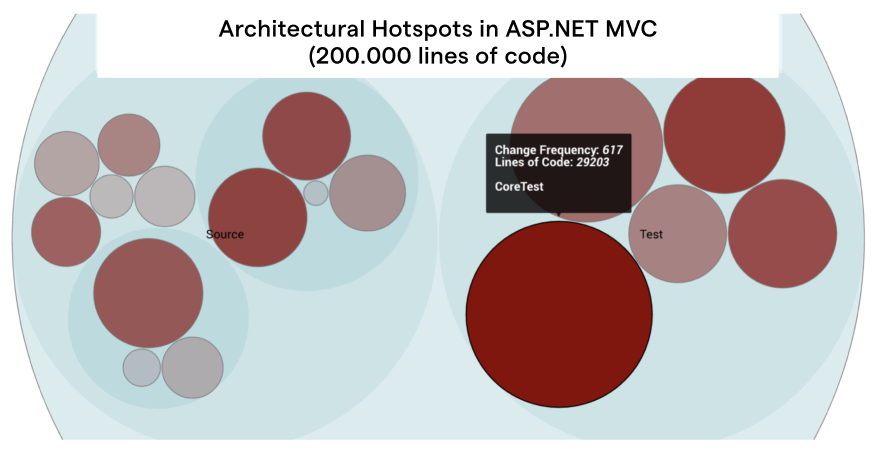
An architectural Hotspot analysis in CodeScene Enterprise Edition.
In the visualization above, each circle represents an architectural component. We see that our main Hotspot is CoreTest, a part of the automated tests. This is a unfortunately a pattern that I see in many of the systems that I analyze: the worst code tends to be in the test code. It’s almost like we developers make a mental divide between application code and tests. We know that it’s vital that we keep the application code easy to understand and maintain. The test code on the other hand, well, often we’re happy if we get around to write any of it all.
This leaves us in a dangerous spot, because from a maintenance perspective, there’s no difference between tests and application code. If your tests lack in quality they will hold you back in your efforts to evolve the system. So let’s dig deeper into CoreTest. The Hotspot data above shows that we spend close to 25% of all commits on changes to this package. That makes it a prime candidate for focused refactorings.
However, although we managed to narrow down the code we need to inspect from 200.000 lines of code for the total system to 29.000 lines of code in CoreTest, that’s still a lot. So let’s get more details on the maintenance issues by investigating the Hotspots on a file level.
Let the Architectural Hotspots guide your Investigation
CodeScene Enterprise Edition automatically runs a Hotspot analysis on file level. From there we can zoom in on the CoreTest package and investigate its content:

A Hotspot analysis of CoreTest inside ASP.NET MVC
A Hotspot analysis on the individual files inside CoreTest immediately points us to our main suspect, the file ControllerActionInvokerTest.cs. Now, let’s find out how severe the potential problem is by requesting a Complexity Trend analysis from CodeScene Enterprise Edition.
A Complexity Trend analysis looks at the accumulated complexity of all lines of code in the file over time. As you can see in the following picture, ControllerActionInvokerTest.cs has become much more complicated recently:

The complexity trend of ControllerActionInvokerTest.cs.
Our main suspect ControllerActionInvokerTest.cs consists of 2.300 lines of code, which is a lot for any module, but in particular for a unit test. Remember that unit testing is often sold as a way to document behavior. That potential advantage is lost once a unit test climbs to 2.000 lines of code.
Until recently, this is where CodeScene Enterprise Edition stopped. After all, we’ve significantly reduced the amount of code we need to consider as we narrowed down the whole ASP.NET MVC codebase to a single file where improvements matter. Yet, 2.300 lines is still a lot of code. A Hotspot of this size becomes like a system in itself. We’d need a way to find the Hotspots inside that huge class. Let’s see how a new technique codenamed X-Ray helps.
Use X-Ray to get deep insights into code
Now that we’ve identified ControllerActionInvokerTest.cs as a maintenance bottleneck we’re faced with the challenge of improving the code. Again, this is where software evolutionary techniques shine.
Remember that I told you in the previous part of this series that all code isn’t equal? That’s as true in the function/method scope as it is on a class and architectural level. During maintenance you’ll spend more time on some methods than others. CodeScene Enterprise Edition capitalize on this aspect by allowing you to run a Hotspot analysis on a method level. We just click on the Hotspot and select ‘X-Ray’ from the context menu as shown in the following picture:

Request an X-Ray of your Hotspots through the popup context menu.
An X-Ray on a single Hotspot analyses the evolution of each function or method in the file. The resulting patterns show you where you need to focus your refactoring efforts. So let’s see what we find inside ControllerActionInvokerTest.cs:

Top Hotspots in ControllerActionInvokerTest.cs.
As you see in the picture above, the top Hotspot is a method named CreateInvoker. Since all types of analyses are orthogonal to the level they operate on, we can even run a Complexity Trend analysis on the CreateInvoker method. We just click on that button and the following trend comes into view:

Complexity trend of 'CreateInvoker' in ControllerActionInvokerTest.cs.
As you see in the trend picture above, the accumulation of complexity in the CreateInvoker method is responsible for the degenerating trend of the ControllerActionInvokerTest.cs class. It seems like we’ve narrowed down a real maintenance bottleneck - our investigation has paid-off.
The X-Ray table above shows that CreateInvoker consists of 186 lines of code, which is way too much for a single method, but nonetheless something we can reason about. So let’s have a look at the actual code.
Once we open the file ControllerActionInvokerTest.cs we see that CreateInvoker is actually three overloaded methods that the analysis combines into a single Hotspot. The main reasons for this is that you want to consider all overloaded methods as a logical unit when you refactor.
The code has probably changed since I wrote this, but you can always travel back in time with Git to the summer of 2016 and watch the original. Let’s have a look at the first part:

A code smell with control coupling inside the CreateInvoker method.
First of all, as you see in the annotated code above, we notice a classic case of control coupling with the boolean actionThrows parameter. Such flags are a problem since they introduce conditional logic and lowers cohesion by enforcing an additional state. As you see in the code sample, the control coupling also leads to code duplication. None of these design choices play well with maintenance. Fortunately, we can solve all of these problems by a simple refactoring that parameterizes with a delegate instead (for non-C# programmers a delegate is basically a reference to a method). Just let that delegate encapsulate the concept that varies between different callers of CreateInvoker. As a bonus, our calling code will communicate its intent in a better way too.
Now I just want to point out one more maintenance problem in CreateInvoker to emphasize that Hotspots are real problems. Have a look at the following code a bit further down in our Hotspot:

A code smell with mocks inside the CreateInvoker method.
The code smell that worries me the most is the complicated setup of Mock Objects that you see in the annotated source code sample above. Mocks do have their place, but excess mocking breaks encapsulation and tests a mechanism rather than a behavior. And yes, this test strategy is probably the main reason CreateInvoker has grown into a Hotspot. CreateInvoker is basically a setup method used to create the pre-conditions for a test. Due to the Mock strategy, it depends on a lot of details that should be internal to the object under test, ControllerActionInvoker.cs. Now, each time the implementation of ControllerActionInvoker.cs changes, CreateInvoker has to be updated. Not only is this error prone and expensive; You also lose the advantage of using the unit tests as true regression tests.
I could go on like this and dissect the rest of code, but that would distract from the point of this case study, which is much more general than this specific example. So let’s recap what we’ve done and why it is important.
Focus Improvements and Win Big
In this case study we started out with a system of 200.000 lines of code. Using a Hotspot analysis on architectural level, we identified a test package as the most probable productivity bottleneck. From there we followed up with an analysis on file level and identified the file ControllerActionInvokerTest.cs as the most important Hotspot. This is where things got really interesting as we had narrowed down the amount of code we need to consider to just 2.300 lines. It’s a big win compared to speculating about technical debt in 200.000 lines of code, but we learned that we can go deeper. And that’s what we did as we X-Rayed the file and ran a Hotspot analysis on method level. That final analysis allowed us to prioritize just 186 lines of code and still be pretty sure that we get a real return on our investment should we refactor that code.
This reason Hotspots work so well is because power law distributions are everywhere in the evolution of software systems. Quite naturally, we see that some architectural components tend to change much more frequently than others. Now we’ve seen that the same distribution of development activity holds for Hotspots on function/method level too. This gives us a tool to prioritize and forms the foundation of the X-Ray analysis.
In a large system, improvements rarely happen often enough. One reason is because such improvements are high risk and the outcome and pay-off is uncertain at best. This is no longer true. With CodeScene Enterprise Edition and the power of software evolution you make decisions influenced by data.
 With X-Ray from CodeScene you break down the problem step by step.
Resources
All analyses and visualizations are created with CodeScene Enterprise Edition. Contact us for more information on our licensing model.
Empear is building a cloud based version of CodeScene right now. Sign-up for the preview at codescene.io and you’ll receive a free invite once we’re ready.
Cover image original: https://de.wikipedia.org/wiki/Republikanischer_Club
