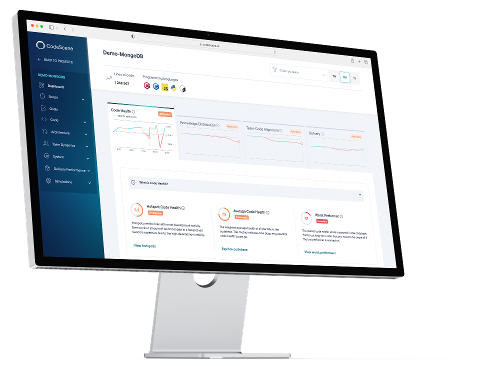
Features
Development speed doesn't have to cost you quality
CodeScene's tools for software delivery metrics ensure complete oversight of your developer output. Understand how your team performance is impacted by factors like unplanned work and organizational trends so you can make more informed decisions about architecture, team structure, and technical debt.
Developers can deploy faster without sacrificing code quality.
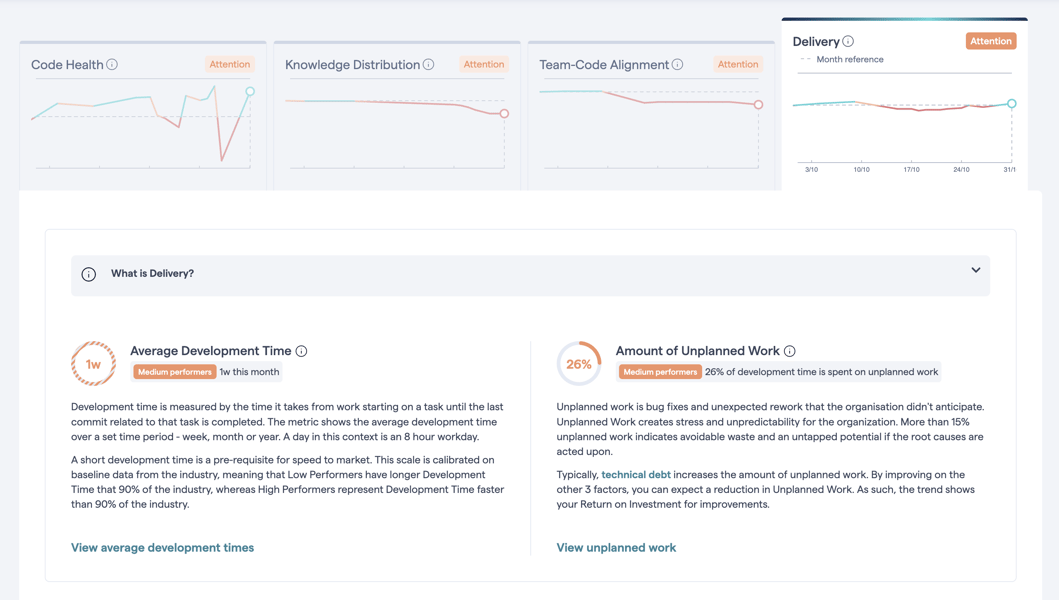
CodeScene's core features for software delivery
How much do you deviate from the roadmap
Planned vs unplanned work
Your team's ability to deliver predictably is directly caused by the amount of unplanned work that comes up during development. By configuring your product lifecycle tools such as Jira in CodeScene, you can see just how much planned vs unplanned work your team is dealing with, even down to the architectural and file level.
Improve delivery predictability
Branch analysis
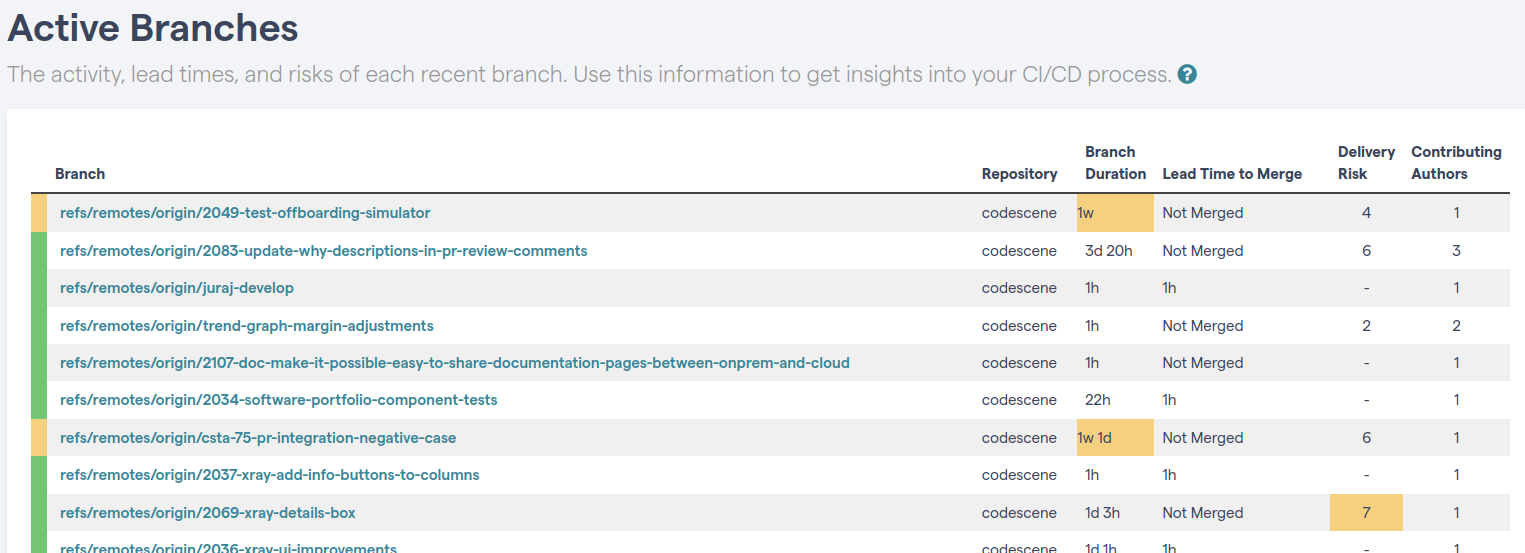
Continuous integration / delivery requires short lived branches. With CodeScene, measure branching activity, different lead times, and risks. Gain insights into your CI/CD process, and better understand delivery and development risks.
Features
Branch analysis
Our Conway's Law visualizations show you how aligned your dev teams are with your system architecture. View primary authors, knowledge risks, technical sprawl, and more. Understand the level of your team cohesion by visualizing whether members work on the same parts of the system

Evaluate team performance
Pull request statistics
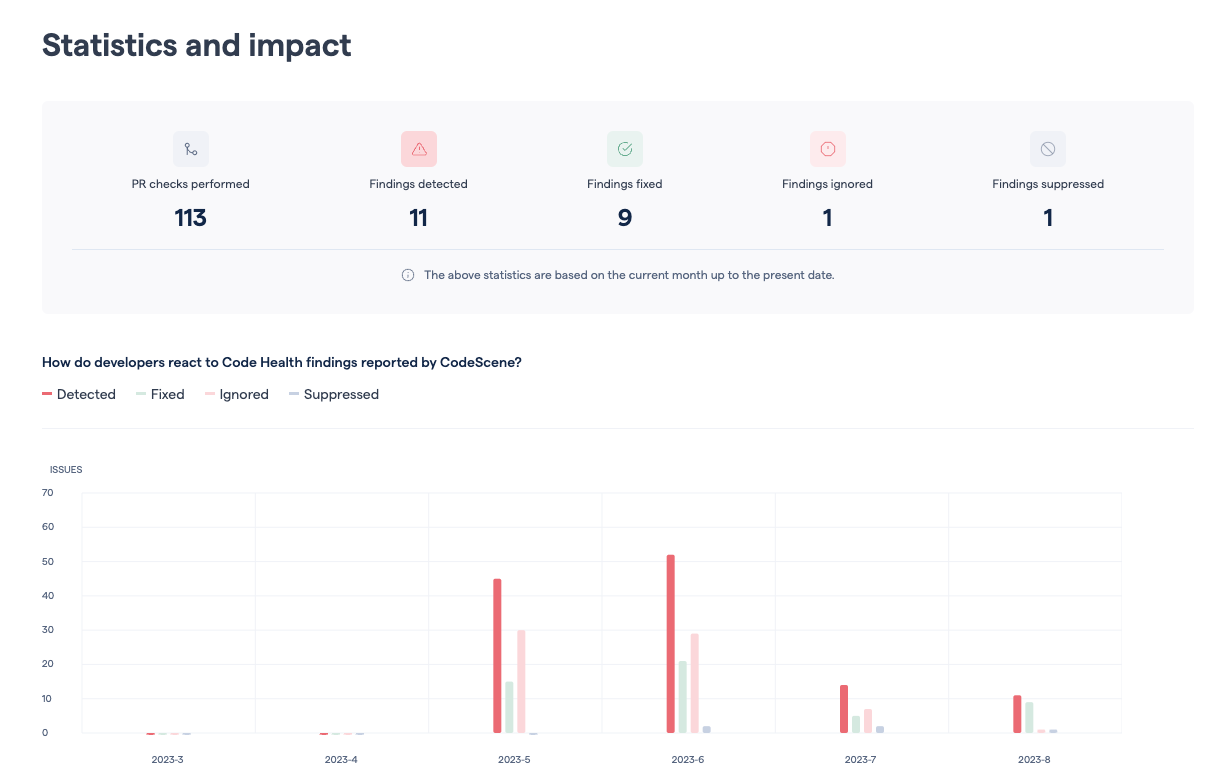
Understand developer performance as it relates to continuous software delivery. When engineering teams configure CodeScene's pull request integration, you see how developers respond to quality gates and automated recommendations in their daily workflow, while also aggregating data for improved code quality insights.
Software delivery
More great features
Measure delivery effectiveness
Measure development throughput in the context of organizational trends based on Brook's Law.
See aggregate author statistics
Get an overview of developer output with contribution statistics and patterns per author.
Predict delivery risks
See if ongoing work has potential delivery risks and if releases are overdue.
View release trends
Get an understanding of your software delivery trends for important metrics like average development time.
Features
See our behavioral code analysis features in action
Code familiarity, knowledge islands, conway's law and more. See how developer team metrics impact your code quality and can lead to potential risks
Resources
We have proof: speed versus quality is a myth
Still believe that to ship code fast, you have to sacrifice code quality? We say not on our watch.
“Early adoption lead to many insights”
"CodeScene provides insights into our developement life cycle that no other tool we use can provide"
Jake Maizel
- VP, Infrastructure and Core Engineering at SoundCloud
“Total gamechanger for software development”
Adam Chapman
- Software Developer, Mid-market company
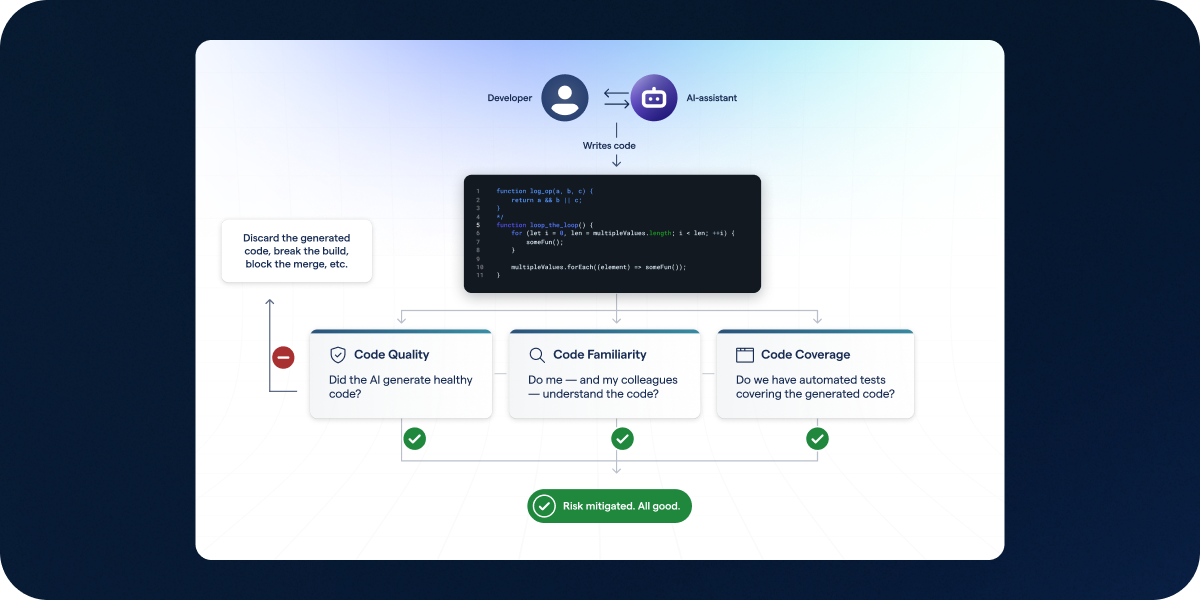
AI-assisted coding is still in its early stages. This article explores the immediate and future impacts of integrating AI assistants into t...
Adam Tornhill

CodeScene awarded Best Paper at the 7th International Conference on Technical Debt 2024 for groundbreaking insights in the field of technic...
CodeScene Team
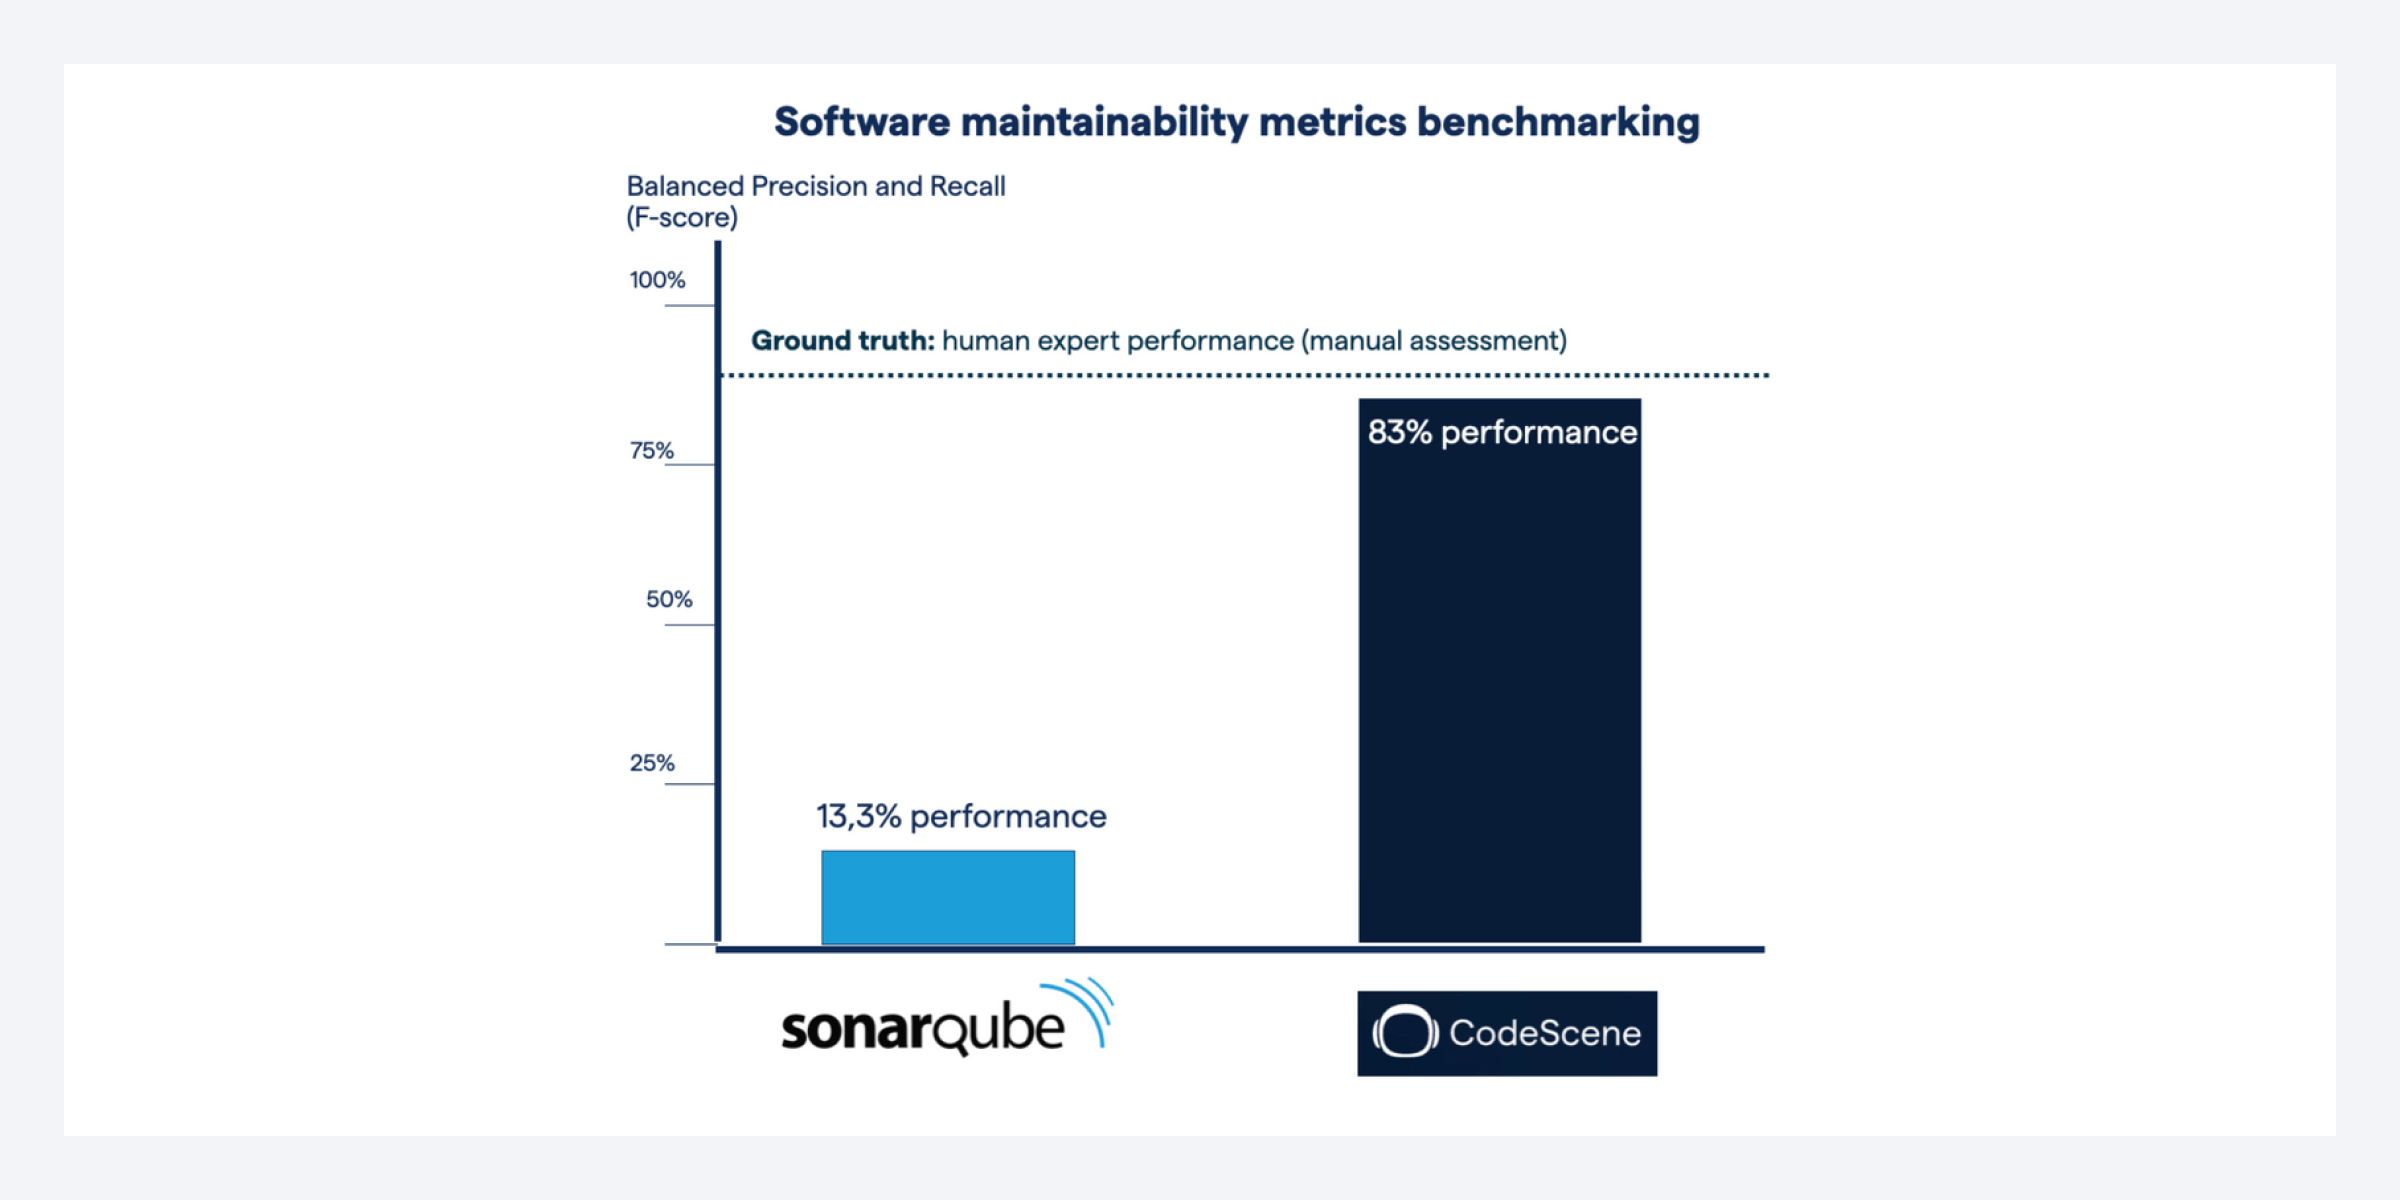
CodeScene surpasses SonarQube by 6 times on the public software maintainability dataset, scoring 83% vs. SonarQube's 13.3% using F-score.

