Part 3: Time - The Hidden Dimension of Software Design

In this part of the Software (r)Evolution series we’ll dive into a concept called Temporal Coupling. You’ll see how Temporal Coupling helps us design better software as we uncover expensive change patterns in our code. As we apply CodeScene’s X-Ray analysis you’ll also learn to uncover subtle and non-obvious relationships across whole clusters of files. As always, we’ll demonstrate the techniques on a number of real-world codebases to identify real problems. This time we’ll continue to explore ASP.NET MVC and peek at findings in different codebases written in Java, C and Erlang. So come along and see how software evolution helps us make better decisions. Let the (r)Evolution start!
Identify Expensive Change Patterns
Now, quick: how do we know if a software design is any good? Sure, we know about the importance of naming, testability, cohesion and all that other stuff. I claim that none of that matters unless we meet a more fundamental goal: a software design is good if it supports the kind of changes we do to the code.
This insight isn’t exactly revolutionary in itself. But what’s surprising is that we, as an industry, haven’t attempted to measure this aspect of code quality before. I think that the main reason for our omission is because time isn’t something that’s visible in our code. As a consequence, we don’t have any detailed mental models of how our codebase evolves. Sure, we may remember the implementation of larger features that transformed parts of the system architecture. But in large projects with hundreds of contributors most details of how our codebase grows are distributed in the minds of different programmers. Code under development is also a moving target and details get lost over time due to the frailties of human memory.
Fortunately, our version-control systems remember our past. Once we embrace that data source, we’re able to measure aspects of software development that we haven’t been able to measure before. So let’s see how we can identify patterns in how our code grows using a concept called Temporal Coupling.
What’s Temporal Coupling?
Temporal Coupling is invisible in the code itself. Instead Temporal Coupling is something we mine from our code’s history, from its evolution. Temporal Coupling means that two (or more) files change together over time.

A Temporal Coupling analysis identifies files that tend to be changed as part of the same task.
CodeScene, that we’ll use in our case studies, provides a number of criteria for Temporal Coupling. The first criteria is where files are changed in the same commit. This is the simplest case. CodeScene also provides more advanced strategies to identify change patterns that ripple across Git repository boundaries. However, in this case study we’ll stick to the simple case of temporal coupling.
With that covered, let’s put Temporal Coupling to work by uncovering hidden dependencies in Microsoft’s ASP.NET MVC.
Discover Files that Change Together
When I investigate temporal coupling I always look for surprising patterns. The reason I use surprise as my starting point is because:
- Surprise is one of the most expensive things you can put into a software architecture. In particular, the poor maintenance programmer coming after us is likely to suffer the consequences of any surprising change pattern we’ve left in the design. Software bugs pave the tracks of such surprises.
- Temporal coupling itself is neither good nor bad; It all depends on context. A unit test that changes together with the code under test is expected. In fact, I’d be worried if that dependency wasn’t there since it would indicate that our tests aren’t kept up to date. On the other hand, if two seemingly independent classes change together over time we might have discovered an erroneous abstraction, copy-pasted code or, which is often the case, both.
So let’s look at the temporal coupling results from ASP.NET MVC. The following visualization shows files that tend to change together in different commits:
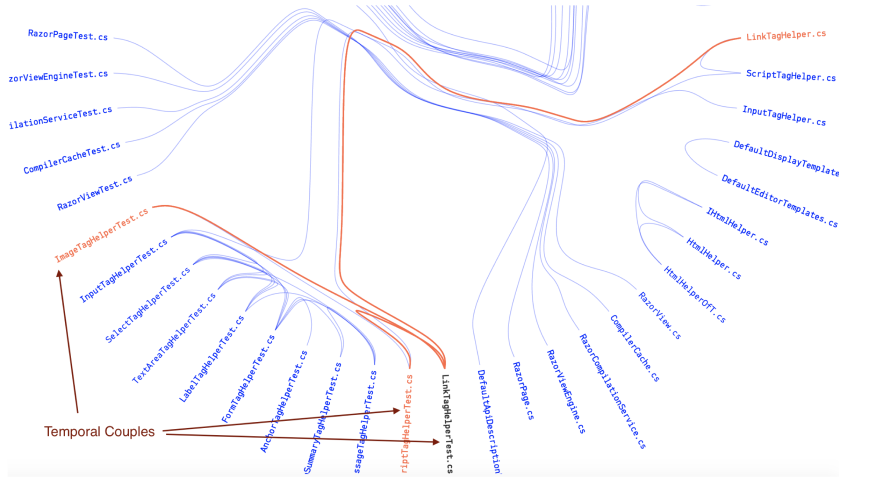
A cluster of unit tests in ASP.NET MVC that tend to be changed together.
CodeScene visualizes temporal coupling as a hierarchical edge bundle. Each file is a node and the temporal dependencies are shown as links. If we hover over a file, its temporal couplings are highlighted. You see an example on that in the visualization above. A unit test, ScriptTagHelperTest.cs, has temporal dependencies to three other files. CodeScene also presents the degree of coupling. In this case, that cluster of files have a high degree of coupling ranging from 54-88%. That means, in more than every second change you do to any of those files there’s a predictable change to the other three files too. Not only is it expensive to maintain code like this. It also puts you at risk of forgetting to update one of the files.
So why would seemingly unrelated unit tests change together? It’s not entirely clear what reasons a ScriptTagHelperTest.cs possibly could have to be modified together with an ImageTagHelperTest.cs. These files model different aspects of the problem domain and we’d expect them to evolve independent from each other. It’s also interesting to note that there’s no direct dependency between the files in that cluster. That is, there’s nothing visible in the code that suggests why those unit tests have to be modified together (this is in contrast to, let’s say, an interface and the classes implementing that interface).
When faced with a surprise like this we need to act. In my Kill The Clones article I showed how a temporal coupling analysis revealed duplicated code. That investigation involved a code inspection of two related files. Now I’ll show you how to automate this process.
Automate Clone Detection with X-Ray
I analyze codebases as part of my day job. As I visit a new customer I don’t have any knowledge of their codebase. That’s part of the reason why I’m so fascinated by these techniques. The analyses let me build a solid understanding of how a system looks in a surprisingly short time. In less than an hour I have a fairly good sense of the main architectural patterns and the organization behind the code. I also know which parts of the code that are most probable to be expensive to maintain. Temporal Coupling helps me understand the way the system grows.
However, there’s one thing that has bothered me for a while. I mean, with these analyses we get a lot of information. And information is only useful if we act upon it. So how do we act upon a surprising Temporal Coupling relationship? Unfortunately it turns out to be extremely time-consuming. Temporal Coupling is something that happens over time so we’d have to inspect the changes between different revisions of the temporal couples. That is, we need to inspect multiple historic revisions and try to spot some pattern. This is impractical and tedious, which means it just won’t happen.
Our case study of ASP.NET MVC is no different. In addition, the coupled unit test files that we need to inspect are fairly large files with ~1.000 lines of code each. So while a temporal coupling analysis is a great starting point to detect expensive change patterns in a codebase, it may be hard to act upon that information.
This is the main reason we developed our X-Ray analysis for CodeScene: we wanted a fast and automated way to find out why a cluster of files change together. So let’s put X-Ray to work.
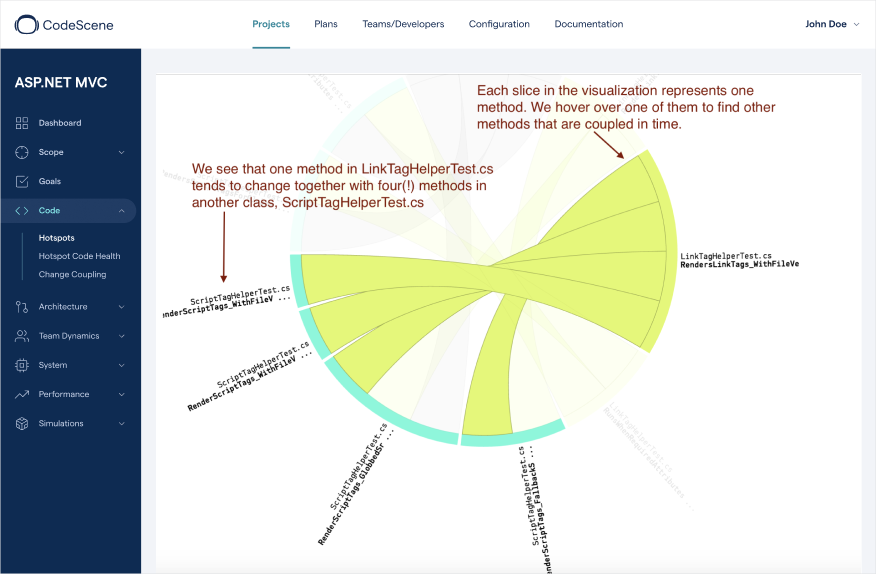
X-Ray uncovers the reason for Temporal Coupling in a cluster of files.
Each slice in the dependency wheel above represents a method in particular file. Since it’s an interactive visualization we hover over one of the methods to highlight its temporal couples. In this case we see that the method RendersLinkTags_WithFileVersion in LinkTagHelperTest.cs changes together with four(!) methods in another unit test, ScriptTagHelperTest.cs. This looks expensive to maintain so it’s a finding I’d prioritize. Since this particular case is around potential quality problems with unit test code, I’d look for the usual suspects: missing abstractions or duplications in the test data. For example, the coupled methods may share the same input data or, which is more common, contain repeated and duplicated assertion statements. Let’s look at an example.

The X-Ray results let us focus improvements the parts that matter, like in this case where we find missing abstractions in the unit tests.
The group of assertions in the figure above is a pattern that’s repeated in different methods. The consequence is that we introduce undesirable temporal coupling with expensive change patterns. If we look closer at the code above we note two missing abstractions:
- We need to model the domain of our tests too and express the concept of test data, for example by introducing an ExpectedContent class.
- We need a specialized assertion statement that encapsulates our test criteria.
I won’t bother you with the details, but after a refactoring like this, that cluster of assertions is replaced by a single statement: AssertContent(expected, output);. This models a concept that’s much more likely to stand the test of time, which means you no longer have to play shotgun surgery as you update the unit
test criteria.
The key point is that with X-Ray we managed to narrow the problem down to just five methods that we need to inspect, which lets us focus refactorings to the code that need it the most. But we can get even more information. Let’s click on the detailed view and detect some software clones.
Find Method Clones in ASP.NET MVC
Once you’ve investigated the overall temporal coupling you want to look at the details. Here’s how they look for our case study:
 X-Ray detects copy-pasted code that actually matters for your productivity.
The detailed view above presents an interesting finding. We see that several methods have a high degree of code similarity. That is, the implementation of several methods is very similar, which is an indication of copy-pasted code.
For example, the highlighted row in the figure above shows that there’s a code similarity of 98% between two methods in different files. Since these methods are changed together in every third commit, this is copy-paste that actually matters for your productivity. Let me clarify by revealing a dirty secret about copy paste.
The Dirty Secret of Copy-Paste
In a previous part of this article series I claimed that low-quality code isn’t necessarily a problem. Now I will continue to dig that hole deeper by claiming that copy-paste code isn’t always a bad idea.
Like everything else, the relative merits of a coding strategy depends on context. You see, copy-paste isn’t a problem in itself; copy-pasting may well be the right thing to do if the two chunks of code evolve in different directions. If they don’t, that is, we keep making the same changes to different parts of the program, then that’s when we get a problem. Not before.
This is important since research on the topic estimates that in your typical codebase, somewhere between 5-20% of all code is duplicated to some degree. That’s a lot of code. We cannot inspect and improve all of it, nor should we. Just as with hotspots, we need to prioritize the software clones we want to get rid of. A Temporal Coupling analysis combined with a Code Similarity metric has proven to be a simple and reliable way to identify the software clones that really matter for your productivity and code quality.
Again, note that this is information you cannot get from the code alone. You need to look at its evolution.
The Power of Language-Neutral Analyses
So far I’ve been torturing a .Net codebase. However, these techniques aren’t limited to a particular technology. The analyses are language-neutral, which means that you can analyze any kind of code and use the same measures to reason about it. The next part of this series will cover analyses of other codebases, but let’s take a quick look at a few examples now.
Discover Temporal Coupling in a Java Codebase
The first case study I want to touch on is Tomcat. Tomcat is written in Java, which is still one of the more widespread languages in our industry. If we do a temporal coupling analysis on Tomcat we’ll find that there’s a strong coupling between two central classes, AprEndpoint.java and NioEndpoint.java. This is a warning sign since both of these classes are part of our top Hotspots. That means we spend a lot of time and effort on that code. So let’s X-Ray them and see what we can reveal:
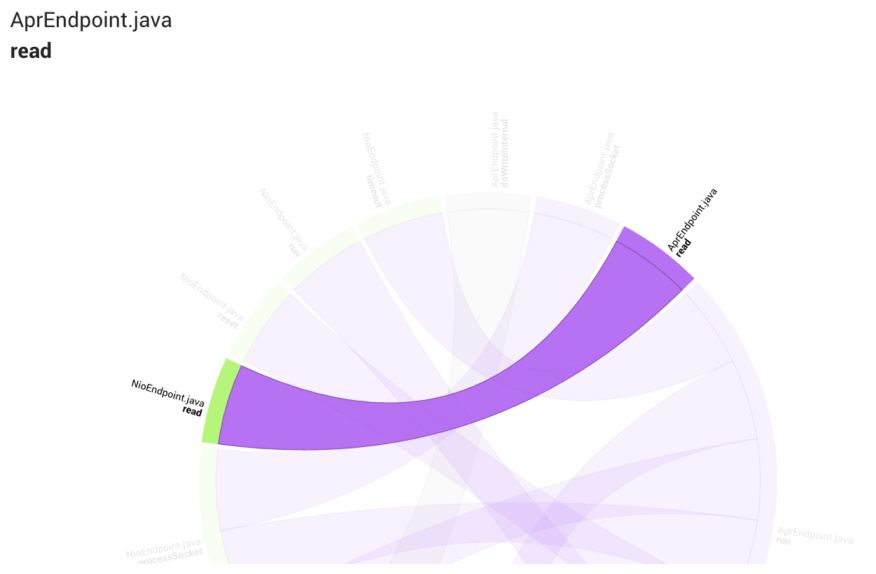
The methods in two different Hotspots that tend to be modified together.
As you see in the dependency wheel above, there are several coupled methods. However, most of them seem to have quite different implementations and their tendency to be maintained together is likely to be due to a shared contract/interface. However, the two read methods in the different classes have a code similarity of 90%. That’s enough supporting evidence to suggest extracting that duplication into a new, shared module.
Discover Temporal Coupling Between Code in Different Languages
Another cool thing with language-neutral analyses is that you can spot patterns between implementations in different languages. This is important because today’s systems are often polyglot codebases. We have an example on that in the implementation of the programming language Erlang.
Erlang is an amazing piece of technology if you happen to work on distributed systems with soft real-time requirements. Erlang is also well-known for its fault tolerance and scalability. Those aspects are largely thanks to Erlang’s powerful OTP libraries. Now, OTP is implemented in Erlang, but the actual run-time system is implemented in tight C code. Let’s look at a case where we have a temporal relationships between an Erlang and a C part:
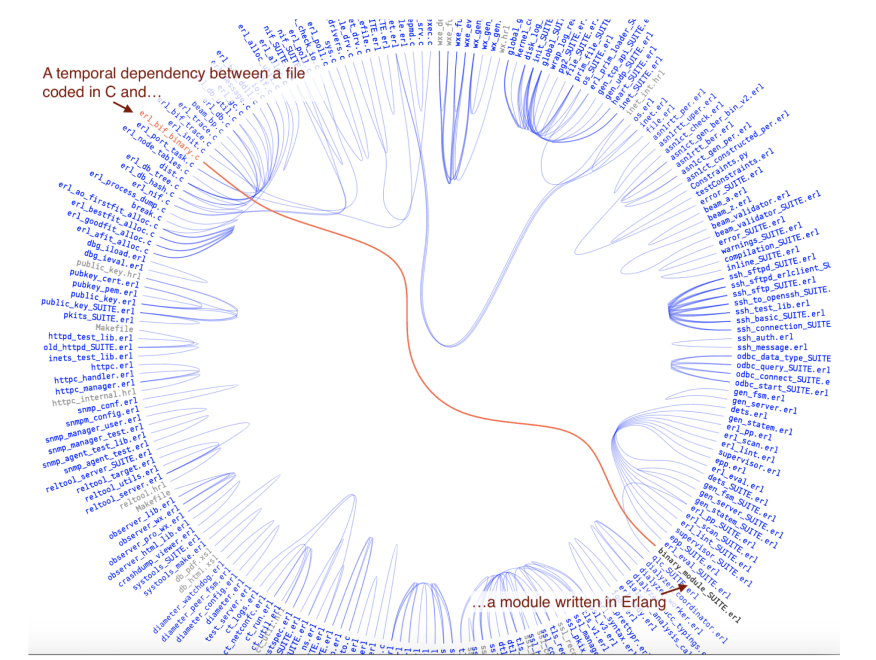
Temporal coupling lets you uncover relationships between files implemented in different languages.
As you see in the figure above, there’s a temporal coupling between erl_bit_binary.c, written in C, and binary_module_SUITE.erl that’s written in Erlang. We could go and actually X-Ray those two files to find out why. However, I’m going to save that case study for a future part of this article series. For now I just wanted to hint at the power of language-neutral software analyses.
Learn More
There’s much more to be said about temporal coupling. Just as we can drill deeper from files to temporal coupling between methods, we can also travel in the opposite direction and analyze temporal coupling between components and sub-systems. We’ll look at that later in this series, but you can dive into those analyses already today: CodeScene makes it easy to get started, so let’s see how we can get the tools.
Try the Tools
The best way to learn more is to try CodeScene, the tool we use in this article, on your own codebases. CodeScene will be available as a service and you’re welcome to sign-up here and be part of the preview.
Empear also provides CodeScene on-premise. The on-premise version is shipped and available now. You get it here.
Read the Earlier Parts of the Series
Software (r)Evolution is a series of articles that explore novel approaches to understanding and improving large-scale codebases. Along the way we’ll use modern data science to uncover both problematic code as well as the behavioral patterns of the developers that build your software. This combination lets you to identify the parts of your system that benefit the most from improvements, detect organizational issues and ensure that the suggested improvements give you a real return on your investment.

.png)