SonarQube is the leading static code analysis tool, and it’s widely used by enterprises for its source code metrics globally. Despite this apparent popularity, the tool has its flaws; Sonar is often criticized for producing a high ratio of false positives. Yet, perhaps more concerning is the tool's approach to code maintainability metrics, which are misleading. This is particularly damaging since maintainability is more important than ever due to Copilot and other AI-assistants which are accelerating the production of new code.
With these challenges in mind, we set out to compare SonarQube’s maintainability scores against CodeScene’s Code Health metric. We’ll cover the details soon, but let’s cut the chase short and look at the benchmarking results:

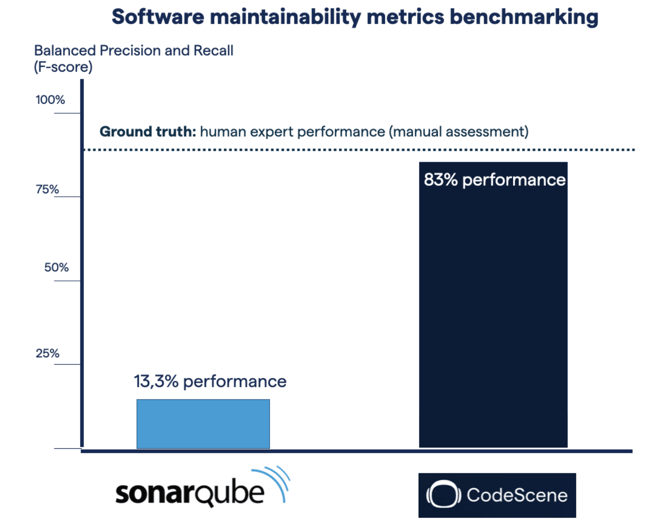
Figure: Benchmarking of SonarQube and CodeScene on the public software maintainability dataset. CodeScene’s Code Health metric is 6 times more accurate than SonarQube.
Now, we weren’t surprised that Code Health outperformed Sonar’s maintainability rating – after all, Code Health was developed as a reaction to the short-comings of Sonar.
What did surprise us was the margin: CodeScene is 6X more accurate than SonarQube and performs at the level of human expert developers.
Benchmarking showdown: SonarQube faces CodeScene
Granted, software maintainability might not be the coolest kid in town: we all think it’s more fun to discuss new tech. Yet, the basic fact remains: unless we sustain a maintainable codebase, no new tools, programming language, or infrastructure will help. There are two key reasons for this:
- First, software maintenance accounts for more than 90% of a software product’s life cycle costs.
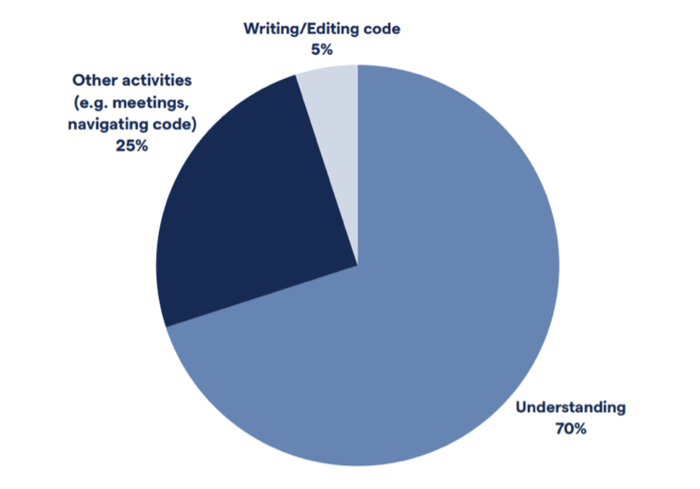
- Second, developers spend 70% of their time on understanding existing code and just a mere 5% writing new code.
 Figure: The majority of a developer’s time is spent trying to understand the existing system (data from Minelli, et. al., 2015)
Consequently, reliable maintainability metrics are fundamental. So how do we know if one metric is better than the other?
Fortunately, there’s a public software maintainability dataset thanks to the work of Schnappinger et al. They had 70 human experts assess and rate 500 files from 9 Java projects for maintainability. The data includes a total of 1.4 million lines of manually reviewed code. It’s a massive effort, which makes it possible to get a ground truth for code quality (e.g readability, understandability.
The beauty of a public benchmarking set is that anyone can reproduce these numbers using the same tools. That helps remove the potential elephant in the room – me. Everyone knows that I’m biased, being the founder of CodeScene. With a public benchmarking set, we reduce that bias and can make a fair comparison. For that I’m grateful for the hard work by the researchers – it’s a valuable service to the whole industry.
In the study, we simply ran SonarQube and CodeScene on the benchmarking dataset to compare their code quality metrics:
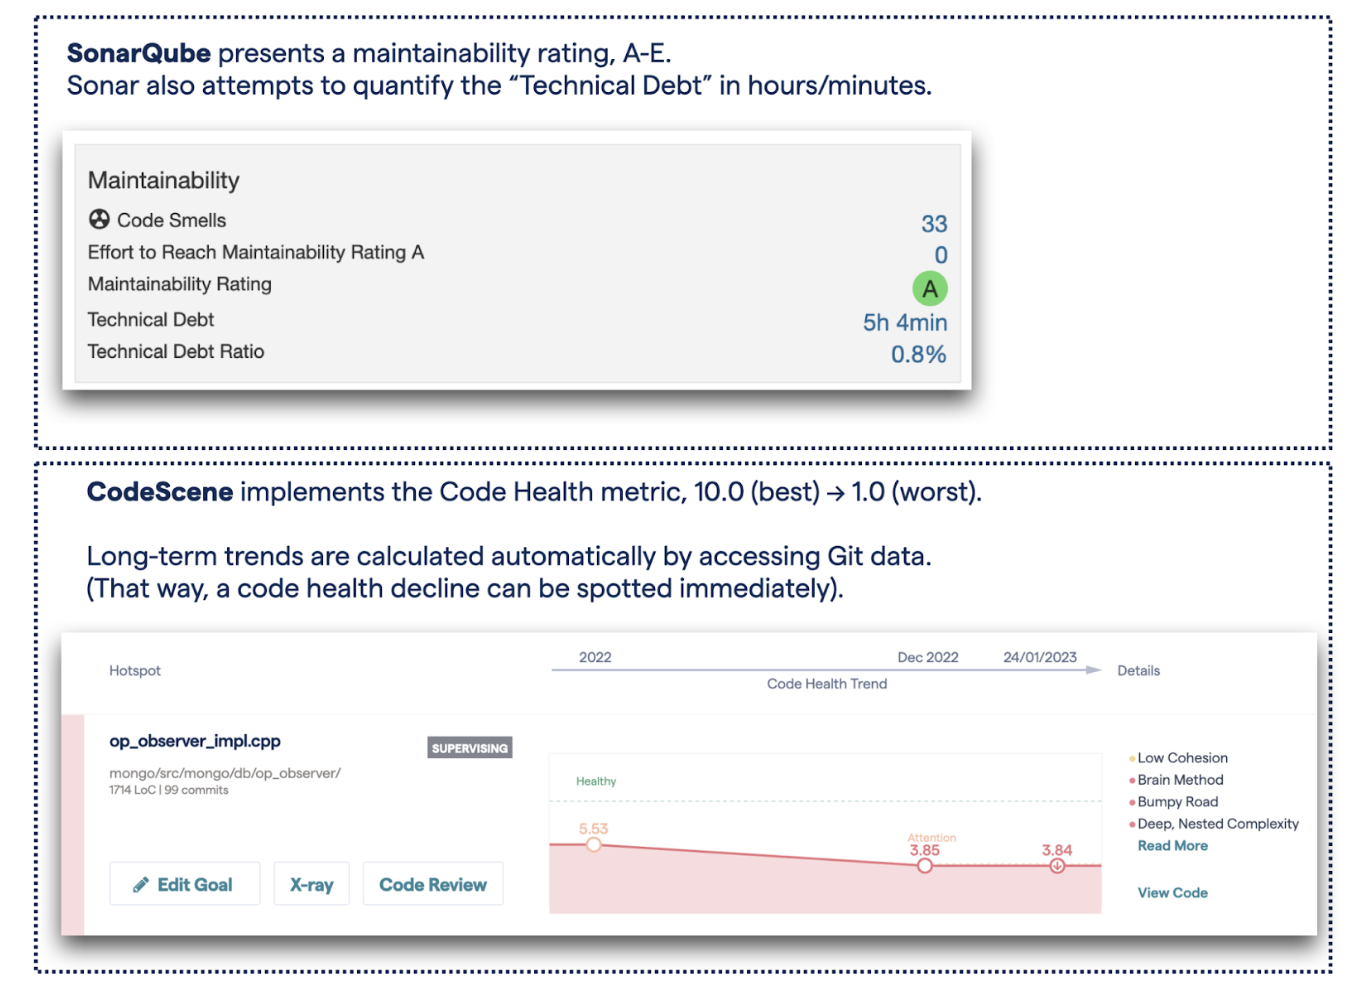
- SonarQube implements a Maintainability rating, A-E where A is the best, E is the worst.
- CodeScene uses the Code Health metric which goes from 10.0 (best) to 1.00 (worst).
 Illustration: The metrics presented in their respective code analysis tool.
For a balanced benchmarking measure you want to consider both Recall and Precision. That is, the metric should be able to reliably identify problematic code without false negatives flagging “good” code as unmaintainable, or vice versa. (For the statisticians reading this, the benchmarking study calculated an F-score).

As we see in the preceding table, CodeScene came (very) close to the level of human experts (88% vs 83% for the tool). The obvious difference is that the tool does its analysis in seconds, whereas an expert needs weeks for this amount of code.
Anyway, those numbers are in stark contrast to SonarQube’s Maintainability Index which achieved a mere 13.3% correctness level. Let’s consider the implications.
The danger of poor code level software metrics
What do these scores mean in practice? Well, as I wrote in the introduction, maintainable code is fundamental to any company building software. It’s a competitive advantage, impacting everything from roadmap execution to both developer productivity and happiness. As such, I always recommend businesses to make code quality a key performance indicator, reported and discussed at the leadership level. It’s that important.
However, a maintainability metric with a mere 13.3% performance does more harm than good:
- Acute problems are missed. This is dangerous as it lures organizations into a false sense of security: “We’re getting a maintainability score of A, so everything must be good”.
- Engineering hours are wasted. This happens when the tool reports false positives, eg, low D and E scores for perfectly fine code: we would try to “fix” code which doesn’t need to be fixed.
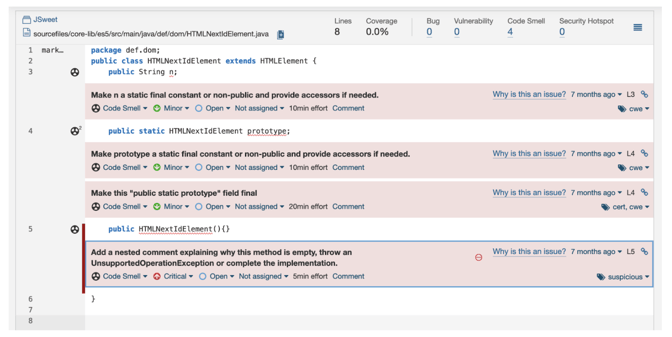
 Figure: The bulk of SonarQube’s measures are low-level style findings which – frankly – neither make nor break maintainability. The above three (3!) lines of simple Java declarations are claimed to take 45 minutes to fix (the “technical debt” metric).
As such, a poor metric does more harm than good. Fortunately, we see in this benchmarking report that there are objectively better and more modern metrics. So let’s close with a quick discussion of why CodeScene’s Code Health metric outperforms SonarQube’s maintainability rating.
How is Code Health the better software metric?
I have it from reliable sources that CodeScene originally didn’t plan to develop a new maintainability metric. Instead, the idea was to use a 3rd party tool – like SonarQube – for the code quality measures and focus 100% on the behavioral code analysis aspects. However, early experiments quickly indicated what we have now studied more formally:
SonarQube’s metrics simply aren’t good enough to predict maintenance problems. Hence, there was no choice but to build a better alternative.
The key to the strong performance of the Code Health measure is that it was built from first principles based on real research which took a much broader perspective; instead of focusing on minor style issues, Code Health detects higher-level design problems. The type of code constructs which do impact our ability to understand and – consequently – maintain code.
CodeScene also published this research for peer reviews and academic publications. (See for example The Business Impact of Code Quality). This was all very intentional: as tool vendors, we should feel a massive responsibility in that what we sell also works as advertised. And there’s no stronger assurance for that than the scientific method. CodeScene was – and will continue – to be developed with one foot firmly planted in research land.
SonarQube did succeed in bringing code analysis to the mainstream, and the tool might have been the obvious choice in 2007. However, my calendar now says “2024”. It’s time for the next generation of code analysis – your code deserves better!