We at CodeScene make heavy use of CodeScene tool ourselves.
We use the tool as part of our services. Over the past years we have analyzed hundreds of different codebases, and there are some patterns known to correlate with increased maintenance costs that we have seen repeated over and over again. Thus, we taught the CodeScene tool how to auto-detect those patterns.
We call the feature code biomarkers. We chose that name because we wanted to avoid terms like “quality” or “maintenance effort” since they suggest an absolute truth; instead, we wanted a concept that doesn’t judge, but acts like a friendly, unbiased, and skilled team member.
Measure Your Code Health
In medicine, a biomarker is a measure that might indicate a particular disease or physiological state of an organism. CodeScene’s biomarkers do the same for code. Combined with our biomarker trend measures, you get a high-level summary of the state of your hotspots and the direction your code is moving in; does it get better or worse over time?
CodeScene's Code Biomarkers show the status of your hotspots at a glance, here an example from React.
CodeScene aggregates individual biomarkers into an overall Code Health metric. The Code Health metric goes from 10 (healthy code that’s relatively easy to understand and evolve) down to 1, which indicates code with severe quality issues.
CodeScene calculates code health using a combination of both properties of the code as well as organizational factors. The factors are chosen based on research, and known to correlate with increased maintenance costs and the risk for defects. We then weight, normalize, and score the findings according to our baseline data to come up with the code health metric.
CodeScene's Code Health summary for multiple codebases on the analysis dashboard.
Detect Architectural Hotspots: Monitor the Code Health of Microservices
Of course, in a larger system, the interesting unit of measure is not the file level but the architectural level. CodeScene supports this by scaling its code health metric to architectural components, such as layers, features, or microservices. That way, you can monitor the code health of each microservice just like you would supervise their run-time characteristics. Here’s an example from the Spinnaker codebase:
Monitor the code health trends of your microservices.
Should an architectural component or service decline in health, then you can always click on the corresponding element and get a detailed breakdown of which files that are responsible for the decline as well as insights into the reasons. Just click on a hotspot, and CodeScene presents the identified biomarkers.
Supervise Code Health in your CI/CD Pipeline
Now, once code has declined in health, it usually requires a significant effort to bring it back on track. That’s why it’s important to catch degradations early. For that purpose, CodeScene comes with integration points into build pipelines and pull requests. That way, you can auto-supervise the code health of your hotspots to ensure that no reckless technical debt is taken on. The next figure shows an example via GitHub’s checks API, a completely automated integration via CodeScene:
CodeScene's context aware quality gates detect any violations of your planned technical debt goals.
Another interesting visualization point is via your codebases landing page, e.g. your README on GitHub/GitLab/BitBucket. By embedding CodeScene’s status badges, you provide visibility into a core metric for all developers:
Embed status badges to communicate the current code health.
Metrics must be Actionable
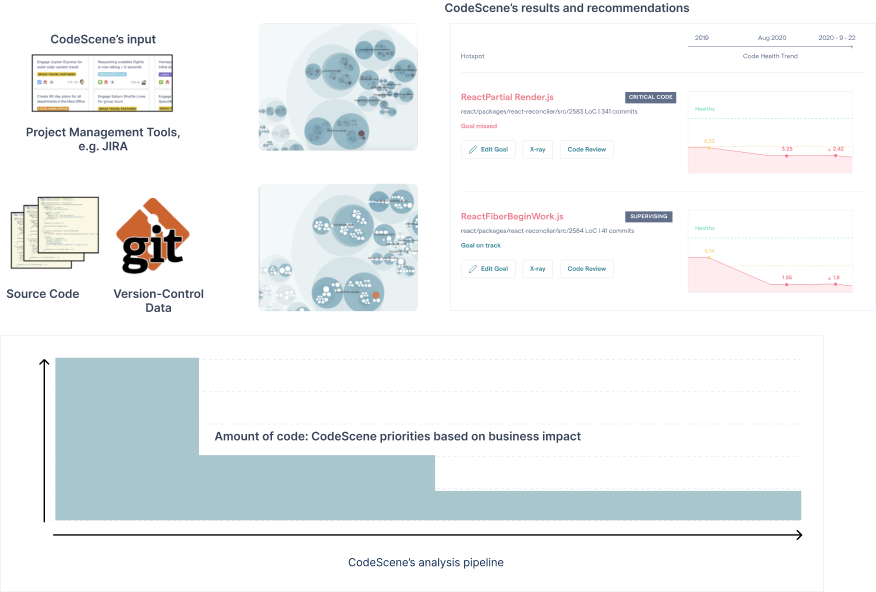
The biomarkers and code health concepts are built on baseline data from thousands of codebases. To make the resulting information actionable, the code health concept is built on top of CodeScene’s other metrics. That means we only score the prioritized parts of the codebase, the parts that are most likely to impact development and maintenance costs.

CodeScene’s results and recommendations

Biomarkers are built on top of CodeScene's prioritized hotspots to make the resulting information actionable.
All together, the code health concept supports an organization by helping:
- Bridge the gap between developers and non-technical stakeholders: The code health trends let you decide when it’s time to take a step back and invest in technical improvements, versus when it’s OK to continue to add features at a high pace.
- Get immediate feedback on improvements: Biomarker trends give you immediate and visual feedback on the investments you make in refactorings. Not only is it motivating – it also helps ensure that you’re on track. Best of all: you get this feedback directly in your pull requests.
- Share an objective picture of your codebase: A successful project is one where everyone has a shared understanding of what the code looks like and how it evolves.
Calculate the Code Health of Your own Code
The code health feature is available in both CodeScene on-prem and the CodeScene SaaS. Contact us if you want to know more and get started with CodeScene – your code is worth it.