Code quality is a largely subjective concept filled with misbeliefs. One such idea is that there's an inevitable trade-off between speed and quality. According to that line of thinking, writing properly designed code would slow us down. Another commonly held belief is that when we talk about improving code, we're somehow at risk for over-engineering.
In this post I want to debunk these myths. And I'd like to do so by showing you some quantitative data on how a business benefits from improving its code. Only so can we make code quality objective and get traction at the business level. If you ever struggled to motivate a larger refactoring or re-design, then this article provides the ammunition you need. Let's start by defining code quality.
Code Quality is a Multi-Faceted Concept
Back in 2022, my research colleague Markus Borg and I published the Code Red paper. In that paper, we established the relationship between code quality and business impact in terms of a) speed-to-market, and b) the number of defects.
-2.svg)
This type of empirical data should make the business advantage of a healthy codebase unmistakably clear. After all, if a task can take up to an order of magnitude longer when working in unhealthy code compared to healthy code, that puts the business at risk: maybe you’d need 9 months for implementing a certain capability, but your competitors with Green Code can get the same thing in less than a month.(Check out the formal research paper for details on how we collected the data, controlled the biases, or the simpler whitepaper for an executive summary of the findings.)
The foundation for the Code Red study is the Code Health metric, so let’s look at that before we dive deeper into business impact.
 Code Health: an aggregated metric based on ~25 factors
Instead of looking for that one magical quality metric -- be it code coverage, cyclomatic complexity, code clones, etc. -- Code Health acknowledges that code quality is a multi-faceted concept. As such, Code Health samples ~25 design properties from the code, aggregates the findings, and uses the resulting scores to categorize code as being either Green (healthy, easy to understand), Yellow (complicated, hard to maintain), or Red (high-risk for defects, expensive to maintain).
Towards a high-resolution view of code quality in a business context
The Code Red paper was impactful, but we also knew that there was more to it. For example, using the three categories of Code Health makes it easier to communicate with non-technical stakeholders. However, the categories are broad and might hide important details; there's a clear difference between code inside the same category. Some Red Code is more problematic than others.
Under the hood, the Code Health metric uses a scale from 10.0 (perfectly green code) to 1.0 (problematic spaghetti code). Since we had access to this high-resolution data, our data science team went to work on the data set consisting of measures from 50+ proprietary codebases, including file-level reporting of time-in-development and the number of defects.
Based on the high-resolution data set we performed a polynomial regression to identify the relationship between Code Health and the business impact. Let’s look at the results:

 The non-linear relationship between Code Health and business value.
As you see in the preceding figure, the relationship is non-linear. The right hand part of the curve is especially interesting: it shows that even a healthy codebase with a Code Health of 9.0 (the lower boundary for Green Code) hasn't reached its full potential. Going the extra mile and improving that code increases value creation for the business. So, what is that value creation?
"Value creation" in the preceding S-curve is simply the combined value of
a) improving the speed to market via quicker development time, andb) reducing the amount of unplanned work due to a decrease in post-release defects.
This means that improving a file or group of files beyond the 9.0 level will lead to progressively better outcomes. At the same time, the S-curve also shows that letting the code quality slip below 4.0 leads into a deteriorating spiral where the code becomes a high-risk drag on the business.
As such, this S-curve serves as both a promise and a dire warning that you can use to make the business case for refactoring. Let's see how.
Make the business case for refactoring
Today, refactoring is a mainstream practice. Yet it might be a hard sell. Beyond the smaller improvements you would do as a natural part of working with the code, larger refactorings and re-designs typically need a buy-in from product people or management. After all, few of us can just decide that "oh, I'll just ignore all feature requests for the next three weeks and clean up this code instead". Those conversations are hard since refactoring doesn't deliver any obvious customer value. Especially not in the short-term where it competes with the pressure of adding new features.
Fortunately, by using the preceding S-curve, refactoring and code health improvements can come with a business expectation. This is data that you want to apply in the context of your road map.
As an example, let's say that you have five planned features that all involve a hypothetical `Engine` component. Let’s also say that that `Engine` happens to have a Code Health of 6.0. As shown in the S-curve above, even a minor lift to 8.0 would deliver tangible benefits, meaning those planned features can be implemented both faster and with less risk for defects.
Better, using this regression data we can even estimate what the improvement in Code Health would mean in business terms. Take a look at the next figure.
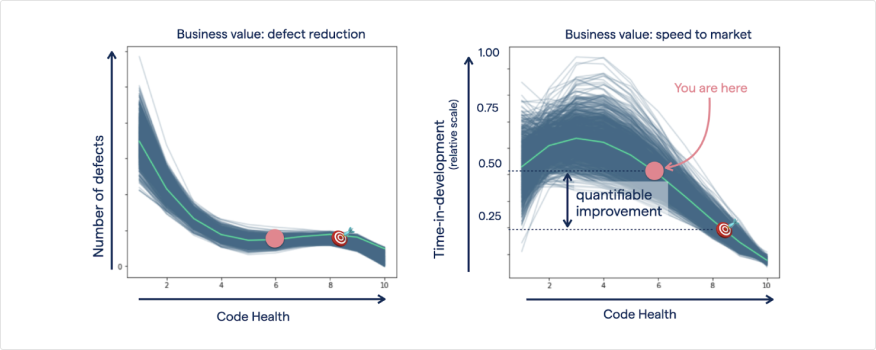 Improving from a Code Health of 6 to 8 has only a marginal impact of defect reduction, but a massive improvement in time-to-market.
You see that moving from 6.0 to 8.0 has only a marginal impact on defect reduction, but quite a dramatic improvement on time in development. This means your team can iterate 33% faster, on average, on your coding tasks. All tangible benefits that let you communicate the value add in terms the business (e.g. PO, PM, Manager) understands.
A healthy codebase is a competitive advantage
Obviously, succeeding with software is about more than code: efficient delivery practices, great teams, proper communication and – most critical – building the right thing are all critical for success. Yet code quality is the foundation for all those other aspects. Poor code quality, and you’ll struggle no matter what.
This implies that -- all else being equal -- companies who value code quality have a clear competitive advantage over the ones who don't. You see, there's no trade-off between speed and quality. In fact, as shown in the data, the opposite is true: high-quality code is both faster to write and comes with (much) fewer defects. You can indeed have it all. And if you don’t get it all, you might get neither.

.png)