CodeScene’s project management metrics let you measure where you spend your costs and how the development activity shifts over time.
This information is useful to bridge the gap between the technical side of the organization and the business side, as you let non-technical managers peek into the codebase from a different point of view.
The Need for Cost Metrics
CodeScene’s project management metrics answer two common questions:
- How shall we prioritize improvements to our codebase?
- How can we follow-up on the effects of the improvements we do? Did we really get an effect out of that design improvement?
Sure, a traditional hotspot analysis already addresses these questions and gives us a tool to prioritize. However, there’s a linguistic chasm between developers and managers here: to a manager, the concept of a “commit” doesn’t carry much meaning. A commit is a technical term that doesn’t translate to anything in the world of managers. At the same time, technical debt with high interest rates and low quality code are important subjects to address. So how can we communicate in the language of a manager while still tying our data back to something that carries meaning for the developers responsible for the code?
CodeScene bridges this chasm by introducing a suite of project management metrics. These metrics combine our existing behavioral code analyses with data from project management tools like JIRA, where CodeScene extracts time-based costs (i.e. minutes of time to completion) or story point reports. We then analyze how those costs are distributed across the different parts of your codebase. This gives you Hotspots measured by cost rather than the more technical metrics. Let’s look at an example.
%201.png?width=876&name=pm-arch-costspots%20(1)%201.png)
Calculate hotspots by costs on architectural level.
As you see in the preceding figure, the most developer time is spent in the Web Backend sub-system. This means we want to ensure that the code is easy to understand and to evolve. If not, we want to prioritize improvements to that part. But before we dive into the technical analyses and look for refactoring targets, we’d like to inspect the work trends. Here’s what they look like for the code in the Web Backend sub-system:
Use the trends in type of work to see where your time is spent.
In this example, the work trend shows that there was a burst of critical features added in April. Unfortunately there seems to have been several bugs too, with nearly 40% of the development time spent on fixing defects. Now, if we do some focused refactorings we’d expect that to pay off in the future cost and work trends.
From here we can get much more detailed data by diving down to the file level and identifying the parts of the code where we spend most of our time. Here’s an example:

Get detailed cost metrics on a file level.
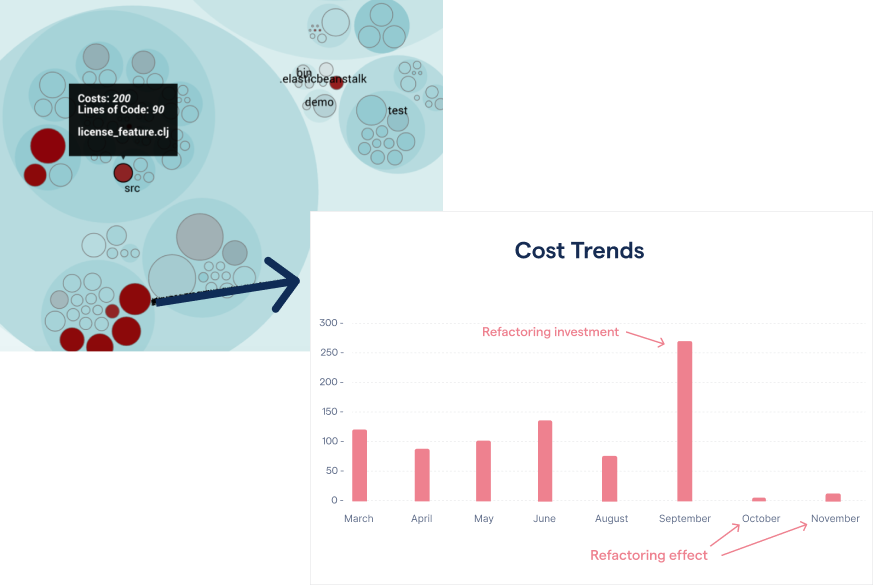
You use this information to ensure that the code evolves in the right direction. For example, you’d like to see a decrease in the amount of bug fixes and an increase in the amount of features. You can also use the cost trends to measure the effect of large-scale improvements.
As a developer, you’ll probably notice that there tends to be a a strong correlation between the project management results and the results from the technical hotspot analyses. This is an expected finding. However, the main purpose of the project management metrics is to provide a basis for communication. Thus, you’d use this data to motivate investments in software quality, like explaining the need for a larger refactoring of a top hotspot.
Try it Yourself
The project management analyses are exclusive to our on-premise version of CodeScene.
CodeScene provides an open API that lets you integrate with any project management tool. CodeScene also comes with an out of the box JIRA integration that supports costs as both time and story points.