Code complexity comes in two different shapes.
We can have implementations where a class or file is hard to understand in isolation due to its excess accidental complexity. Or, a piece of code can look superficially simple, yet the emerging system behavior is anything but simple due to complex dependencies. While these two types of complexity are orthogonal, in practice you'll often find both in the same parts of the codebase.
I've covered local code complexity in the previous article on the speed vs quality myth, so let’s focus on the second type of complexity now – dependencies.
Not all dependencies are equal
Dependency analyzers are an old and tested idea: scan the code, figure out which parts of the code use or invoke other parts, and build up a dependency graph. In a sense this gives you something akin to an architectural blueprint reverse engineered from your code. However, even though I like the practice of visualizing code, the resulting information is rarely actionable. More often than not, the resulting dependency graph comes out as an opaque and hairy ball. There are multiple reasons for this.
First, any non-trivial system will have a myriad of dependencies. Some are perfectly fine – such as using a standard library – while others are major concerns (eg. circular dependencies). Wouldn't it be good if we could separate the expected from the expensive?
Second, a traditional dependency scan ignores the temporal dimension. A stable and well-understood dependency is rarely a problem. What if we could instead highlight the dependencies that do drive the cost of change?
Finally, static analyzers as they fail to reveal logical dependencies. Two tightly coupled services might communicate via a message bus, leaving no visible coupling in the code itself. This type of logical dependencies are frequently causing surprise and frustration. Can we reveal this critical information?
It turns out that these limitations can be addressed by moving beyond code to uncover the behavioral signature of the developers.Only so can we start to treat dependencies as dynamic and temporal. Let's meet the change coupling concept.
Uncover dependencies via developer behavior
Visualizing logical dependencies in the Android Telegram codebase using the CodeScene tool.
The preceding image visualizes the Telegram for Android codebase. Each file with source code is represented as a circle, and the coloring reflects the development activity using the hotspot concept. That way, we can easily see where the action is and focus our inspection on actively developed parts of the code. You also see that the dependencies of a piece of code pops out when we hover over them. Now, this is not your regular static dependencies. Insead, what you see is change coupling.
Change coupling isn't possible to calculate from code alone. Instead, we get this information from developer patterns which we mine from Git repositories. In its simplest form, you have change coupling when certain files/functions/modules continuously co-evolve as part of the same commit sets. This is information you use to evaluate how well a software design holds up by visualizing the cost of change. Let's explore its uses.
Contextualize coupling: evaluate the cost of change
Change coupling in itself is neither good, nor bad: it all depends on the type of dependency. Consider the next figure:
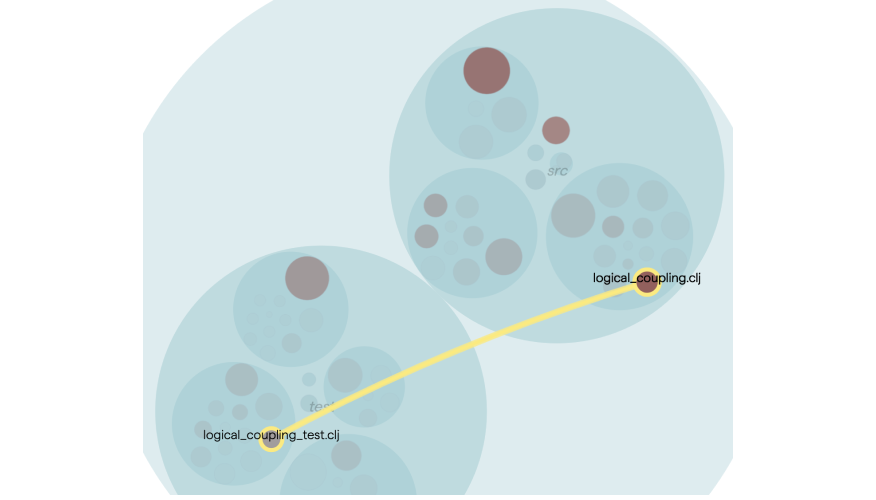
The preceding examples illustrate how a piece of application code co-evolves with its unit test. That's a healthy form of coupling and something we'd expect. In fact, the absence of change coupling between test and application code would be a major concern, indicating that the tests aren't kept up to date with the code.
Another important factor is to make sure that our actual dependencies follow our architectural patterns. You see an example in the next figure:
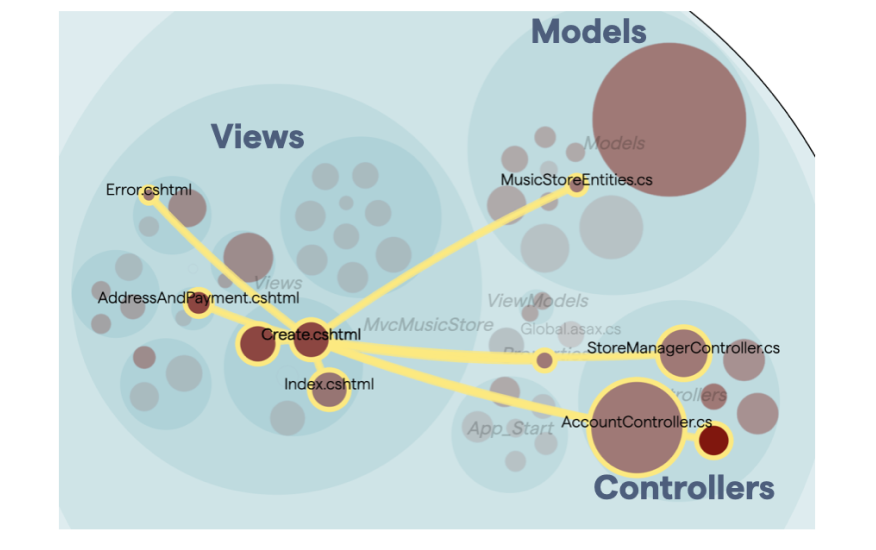
The preceding figure shows a Model-View-Controller architecture, so the coupling is expected. However, visualizing it like this helps us have conversations around the architectural fit: is this really an architectural style which supports the way the system evolves, or could other patterns be a better fit by enabling a stronger locality for each code change (e.g. feature addition or bug fix)?
Finally, in some codebases you simply find tight coupling without any obvious patterns:
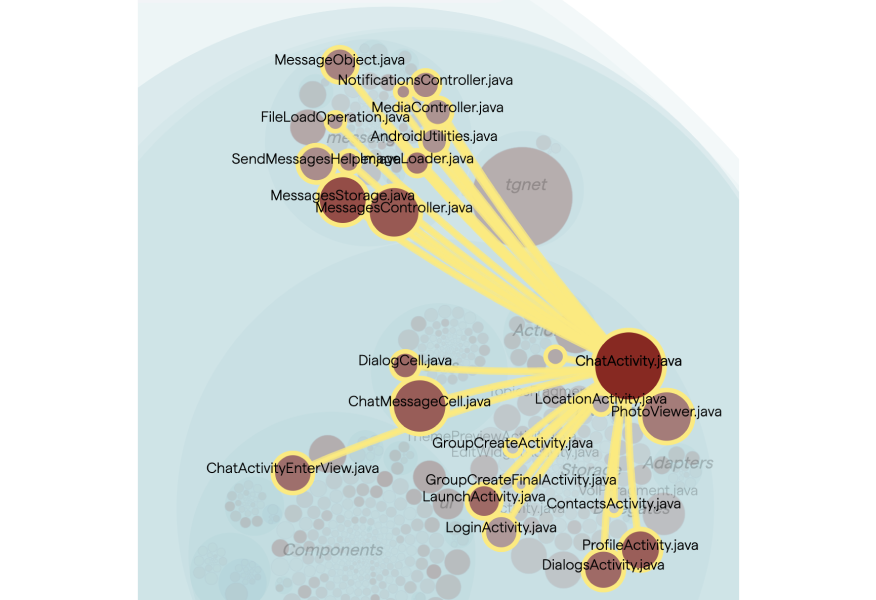
When this happens, the change coupling is often the messenger indicating severe maintenance issues. For example, in the preceding figure, I’d suspect that the ChatActivity.java class is a God Class which has accumulated (way) too many responsibilities and centered the behavior of the system; each time you need to change the code, you end up in the God Class which over time becomes more and more complicated and fragile.
What's next?
Change coupling is a powerful concept, and in this article we have only touched upon the surface of its use cases. For example, change coupling also enables you to identify dependencies crossing team boundaries. That way, you can identify modules or services that logically belong together but are maintained by different teams. This is a use case I’ll return to in a future blog post. Stay tuned.
If you’d like to explore change coupling in your own codebase – you really should – then all visualizations and analyses were done via CodeScene. The CodeScene tool has supported the change coupling analysis from its early days. However, with our latest release we now combine the change coupling visualization with the hotspots and code health maps. This makes it easy to identify the strong and weak parts of any codebase at a glance. Check it out!

.png)