Since starting CodeScene back in 2015, I have probably analyzed around 300 codebases.
Most codebases were around the 500k - 1M LoC mark, but every now and then I come across systems that span tens of millions of lines of code. I’ve always found it most valuable to start any analysis by building situational awareness: are there any deeper quality issues in the codebase? Any critical technical debt with high interest code? Any long-term risks that we need to act on to mitigate?
High-level KPIs have been useful and a valuable starting point. However, anyone that analyses code for a living will quickly learn that there’s never a single KPI that can capture the state of a large codebase.
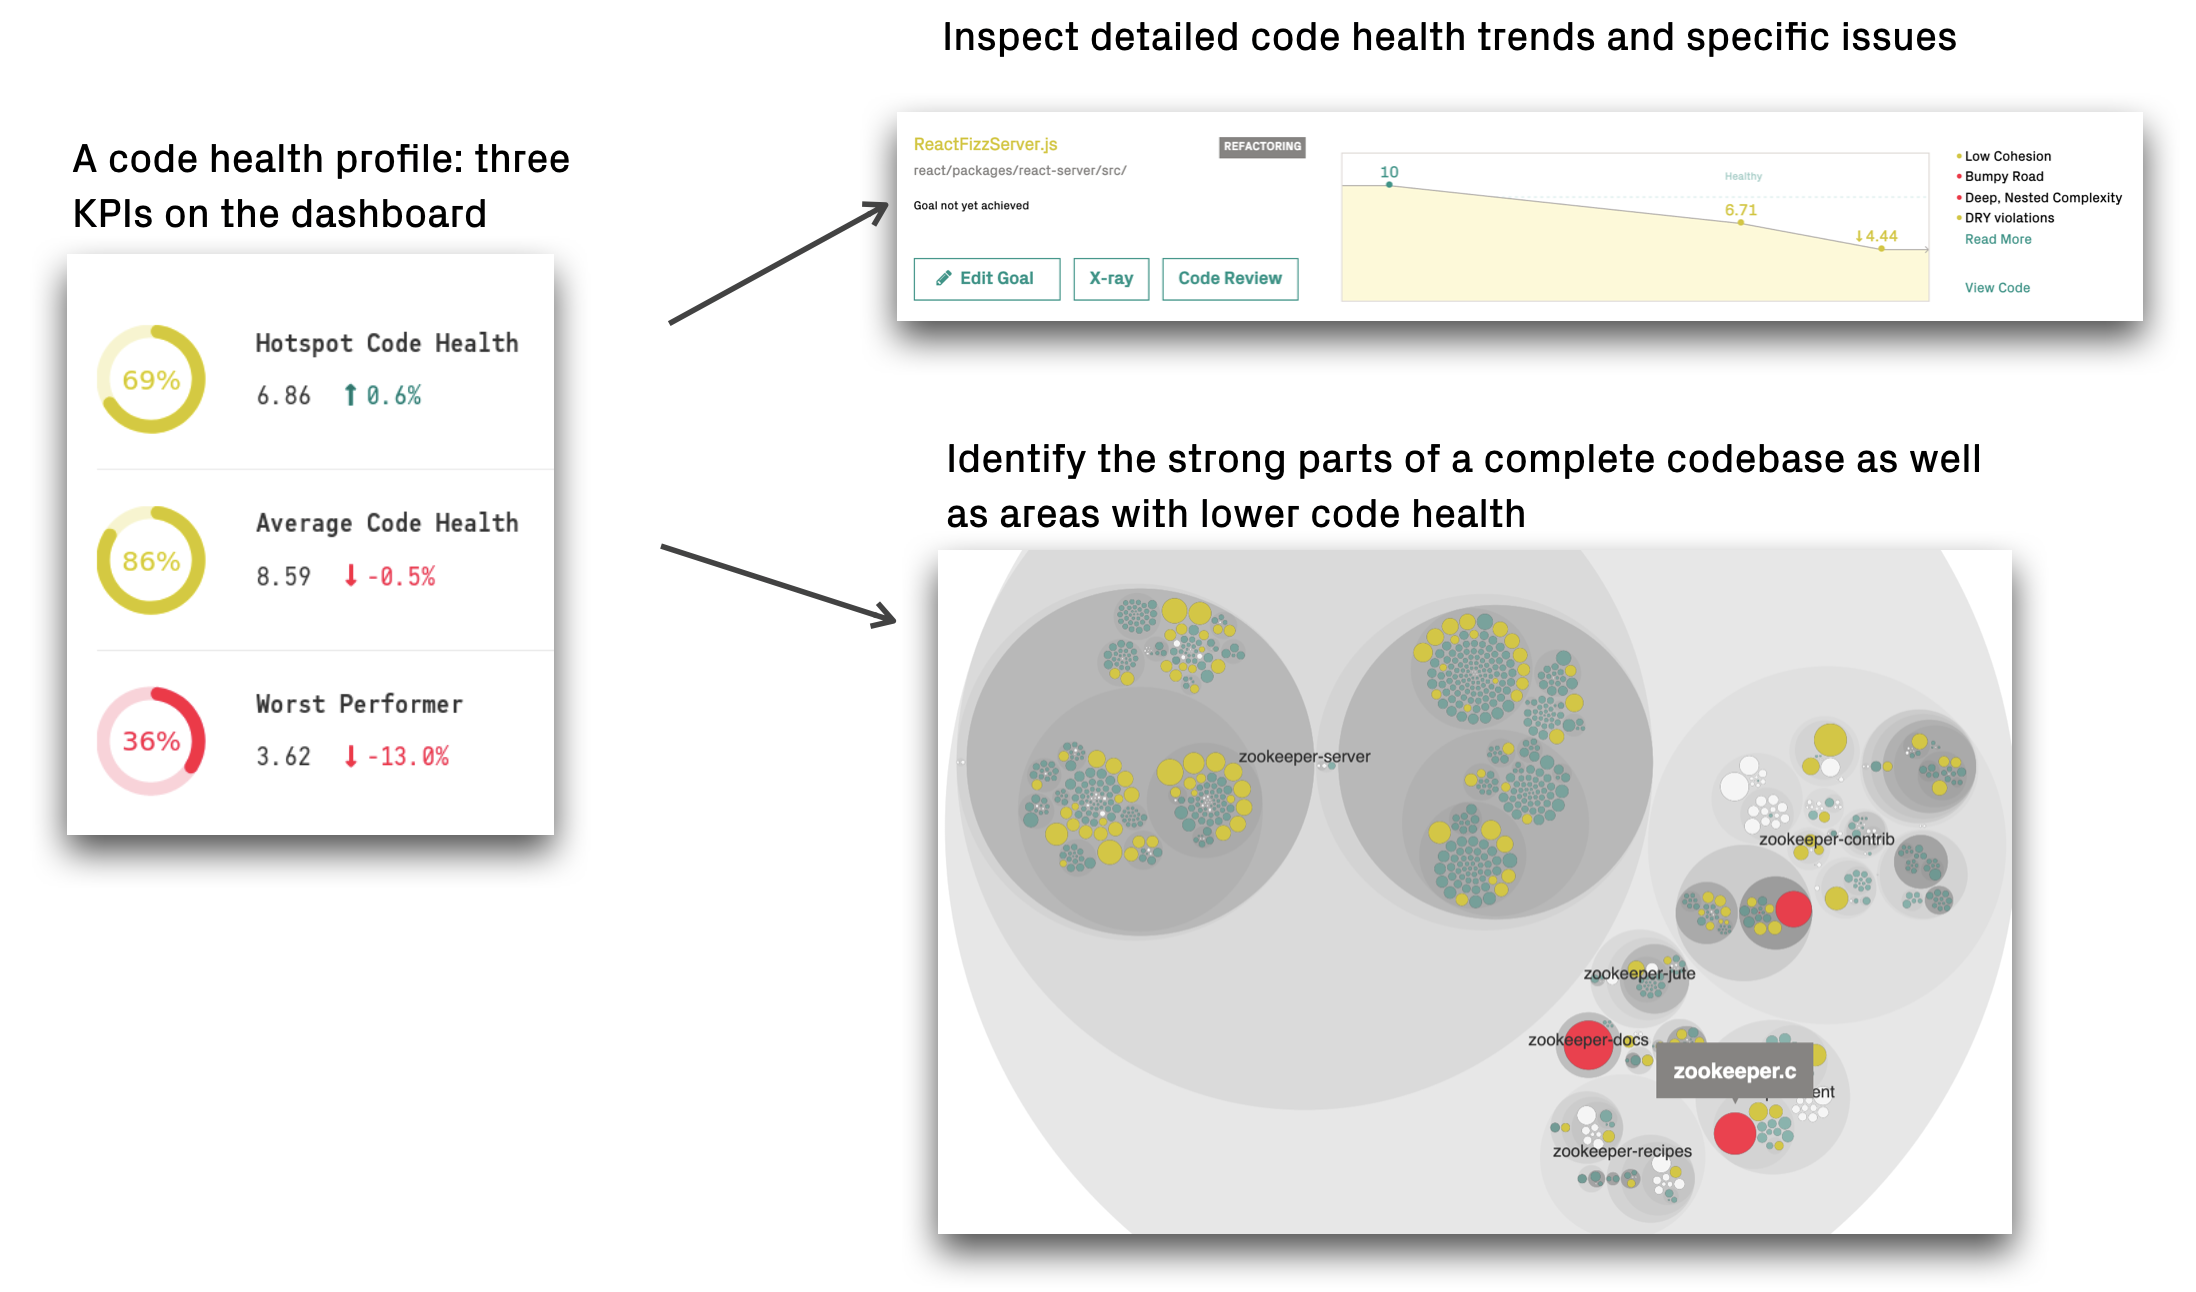
That’s true of the Code health metric as well, which is a multi-dimensional factor that we need to consider within the context of the organization. For that purpose, we recently developed three code health KPIs:

Measure the code health across any codebase and use the KPIs to align all stakeholders.
I’ve been using these KPIs internally over the past months, and they have been a game changer: quickly assessing the health of a large codebase has never been this easy! Let’s see how they work.
The Code Health Profile and main KPIs
The Code Health metric identifies source code that is expensive and risky to maintain. In this post we explore three code health KPIs that together form a profile of any codebase. This lets you make a quick assessment of the current situation and trend:
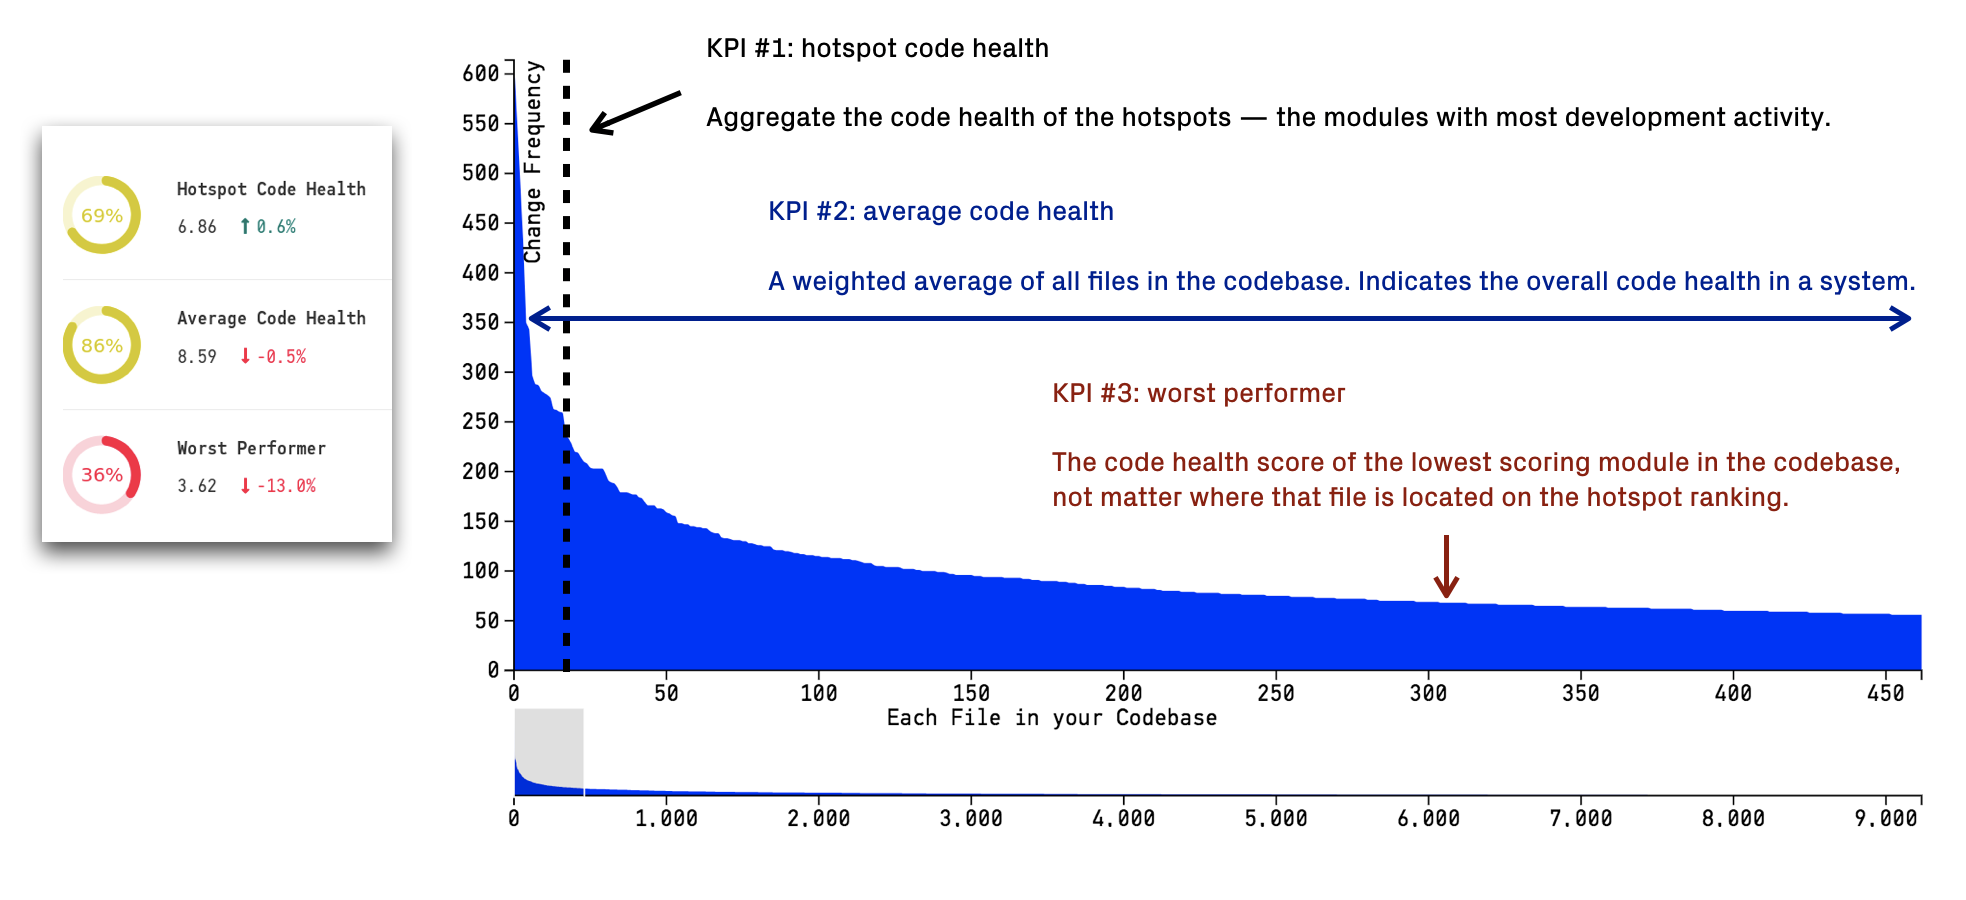
- Hotspot Code Health: A weighted average of the code health in your hotspots. Generally, this is the most critical metric since low code health in a hotspot will be expensive.
- Average Code Health: A weighted average of all the files in the codebase. This KPI indicates how deep any potential code health issues go.
- Worst Performer: A single file code health score representing the lowest code health in any module across the codebase. Points out long-term risks (you know, that specific C++ file that only one long-term contributor ever understood, and of course that person left last spring).
The KPIs are segmented based on the hotspot criteria:

The three KPIs give you a representative view of the code health.
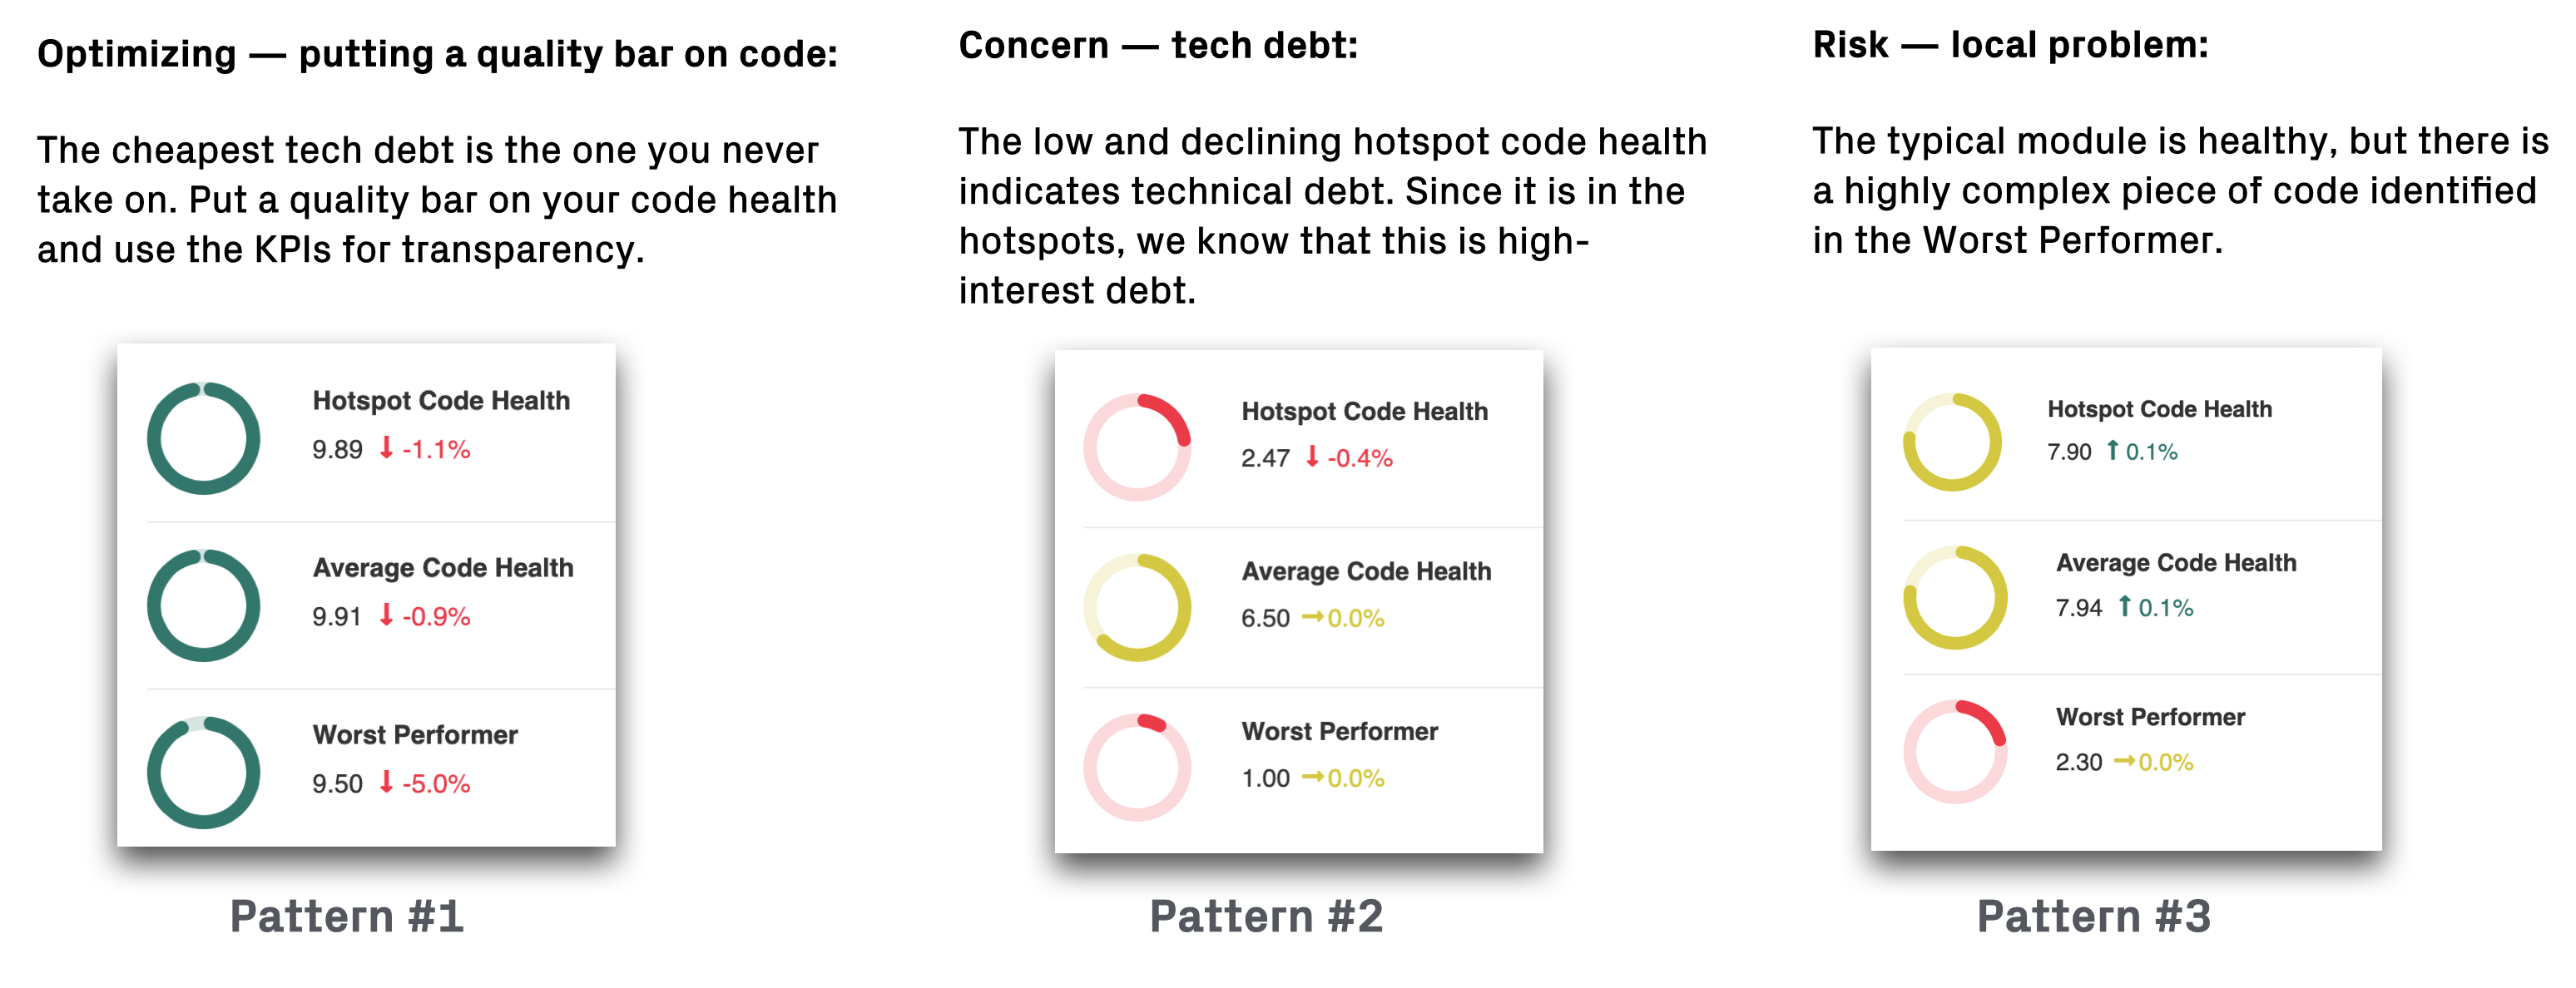
This combination gives us a code health profile that’s unique for each codebase. Some of the most common patterns that I have seen are:

Examples on code health profiles, each one pointing the direction of future actions.
Pattern #1: Introduce a quality bar to keep the code healthy
Pattern #1 shows a situation where all three KPIs are green. This means that any code is healthy. When I come across these codebases they are often quite young and evolving (e.g. a legacy replacement initiative). The focus tends to be on quickly building up new capabilities and getting feature complete. As such, tech debt and long-term risks tend to take the backseat. A simple way of ensuring that the code stays healthy is by putting a quality bar on the code (see automated code reviews withe PR integration for examples).
Pattern #2: Technical debt in Hotspots is expensive
Pattern #2 immediately raises concerns. The hotspots – arguably the most important parts of any codebase – have low health. This drives both development costs and business risk (see how to calculate the business costs of technical debt for tips on how to highlight the issues). Of course, the worst performer shows a low health too, but it should remain a secondary priority until the hotspots are under control.
Pattern #3: Separate short-term issues from long-term risks
Pattern #3 shows a codebase without any immediate concerns. Sure, the hotspot code health could be higher, but the positive trend indicates that the organization works towards that. However, the worst performer points to a module that could be a long-term risk. This is something that it’s important to be aware of in case any work is planned in that area.
Code Health Usage and Tool Support
Code quality issues cost time, money, and missed deadlines. It’s vital for decision making to know when you can safely move ahead and implement new features as well as when you might have to take a step back and improve what’s already there. That way, your system remains maintainable which is the foundation for developer productivity and great products.
At the same time, it’s challenging to involve non-tech stakeholders in discussions around something as deeply technical as code. The three code health KPIs – together with the accompanying visualizations – help you on that journey.
The code health KPIs and visualizations are fully automated via CodeScene. If you want to give it a go, then CodeScene is available for free. Free forever for open source, and a full free trial on closed source.