Does code quality affect AI token costs? Yes, in this study. Across 465 agent-authored pull requests and three LLMs, healthy code needed 22 to 35% fewer tokens for agentic code review than unhealthy code.
Agentic code review is billed per token, and the obvious way to reduce the costs is to keep pull requests small. Pull request size is the strongest driver of cost in our data. However, the 465 agent-authored pull requests from 246 repositories point to a second driver: the health of the code the agents have to read.
Together with researchers from Lund University, in a study led by PhD student Lo Gullstrand Heander, we looked at what that second driver costs. We ran every pull request through the same five-agent review-and-fix pipeline with three different LLMs. Each point of Code Health, CodeScene's code quality metric, was associated with 3.5 to 6.1% fewer tokens.
Between a typical unhealthy pull request (CodeHealth 2.8) and a typical healthy one (9.7), that adds up to 22 to 35%.
Every pull request your agents review pays that difference again. If you are a CTO or Head of Engineering, that belongs in your AI cost model. The meter runs while the agent reads, and unhealthy code tends to come in much larger files. Let's start with the numbers.
Read the full study: CodeHealth predicts token cost of agentic code review: A pre-registered study of 465 agent-authored pull requests
The setup: five agents, three LLMs, one registered question
The study was designed so that either outcome would be informative. Had pull request size explained everything, the advice would have been to keep pull requests small and leave the code alone. Here is how the study was formed:
- Sample: 465 agent-authored pull requests from 246 open source repositories (AIDev dataset, at least 100 GitHub stars), in TypeScript, Python, Go, C# and JavaScript. The sample was drawn across three Code Health tiers and three pull request sizes.
- Pipeline: four review agents (security, performance, design, logic) followed by one fix agent. The prompts and tools were frozen and identical for every pull request (and the prompts are published in full).
- LLMs: deepseek-v4-flash, qwen3.6 and claude-sonnet-5, each analysed separately because they differ in serving stack and caching.
- Measure: total input and output tokens per pull request. Code Health was measured via CodeScene's CodeHealth MCP server (version 1.4.0, locked), weighted by the lines each pull request changed.
- Registration: hypotheses and analysis plan were pre-registered on OSF in August 2026.
Result: each Code Health point saves 3.5 to 6.1% of tokens
The association holds for all three LLMs, with every 95% confidence interval excluding zero. The smallest saving, 3.5%, belongs to claude-sonnet-5, the most capable of the three. Does that mean stronger models don’t care about code quality? The data doesn’t say so. Even claude-sonnet-5 used clearly fewer tokens on healthier code, and across the Code Health scale the per-point effect adds up. All three LLMs point the same way. Here are the numbers per LLM:
- deepseek-v4-flash: 6.1% per point (95% CI 3.4 to 8.6%), 35.0% across the 6.9-point contrast from Code Health 2.8 to 9.7.
- qwen3.6: 4.8% per point (1.4 to 8.1%), 28.9% across the contrast.
- claude-sonnet-5: 3.5% per point (0.1 to 6.8%), 21.8% across the contrast.
In tokens, the contrast is about 91,000 (claude-sonnet-5), 134,000 (qwen3.6) and 360,000 (deepseek-v4-flash) for a single review-and-fix pass. The three LLMs cache differently, so raw token totals are not comparable across them. Read the percentages within each LLM.
Do small pull requests explain it?
Token cost grows with diff size, so unhealthy code might simply arrive in bigger pull requests. The sampling was built to test exactly that. Diff size was the strongest driver of cost for every LLM, and Code Health was unrelated to it. Unhealthy pull requests were not systematically larger in this sample.
Size and Code Health act as two separate levers. Keeping pull requests small does not substitute for healthy code.
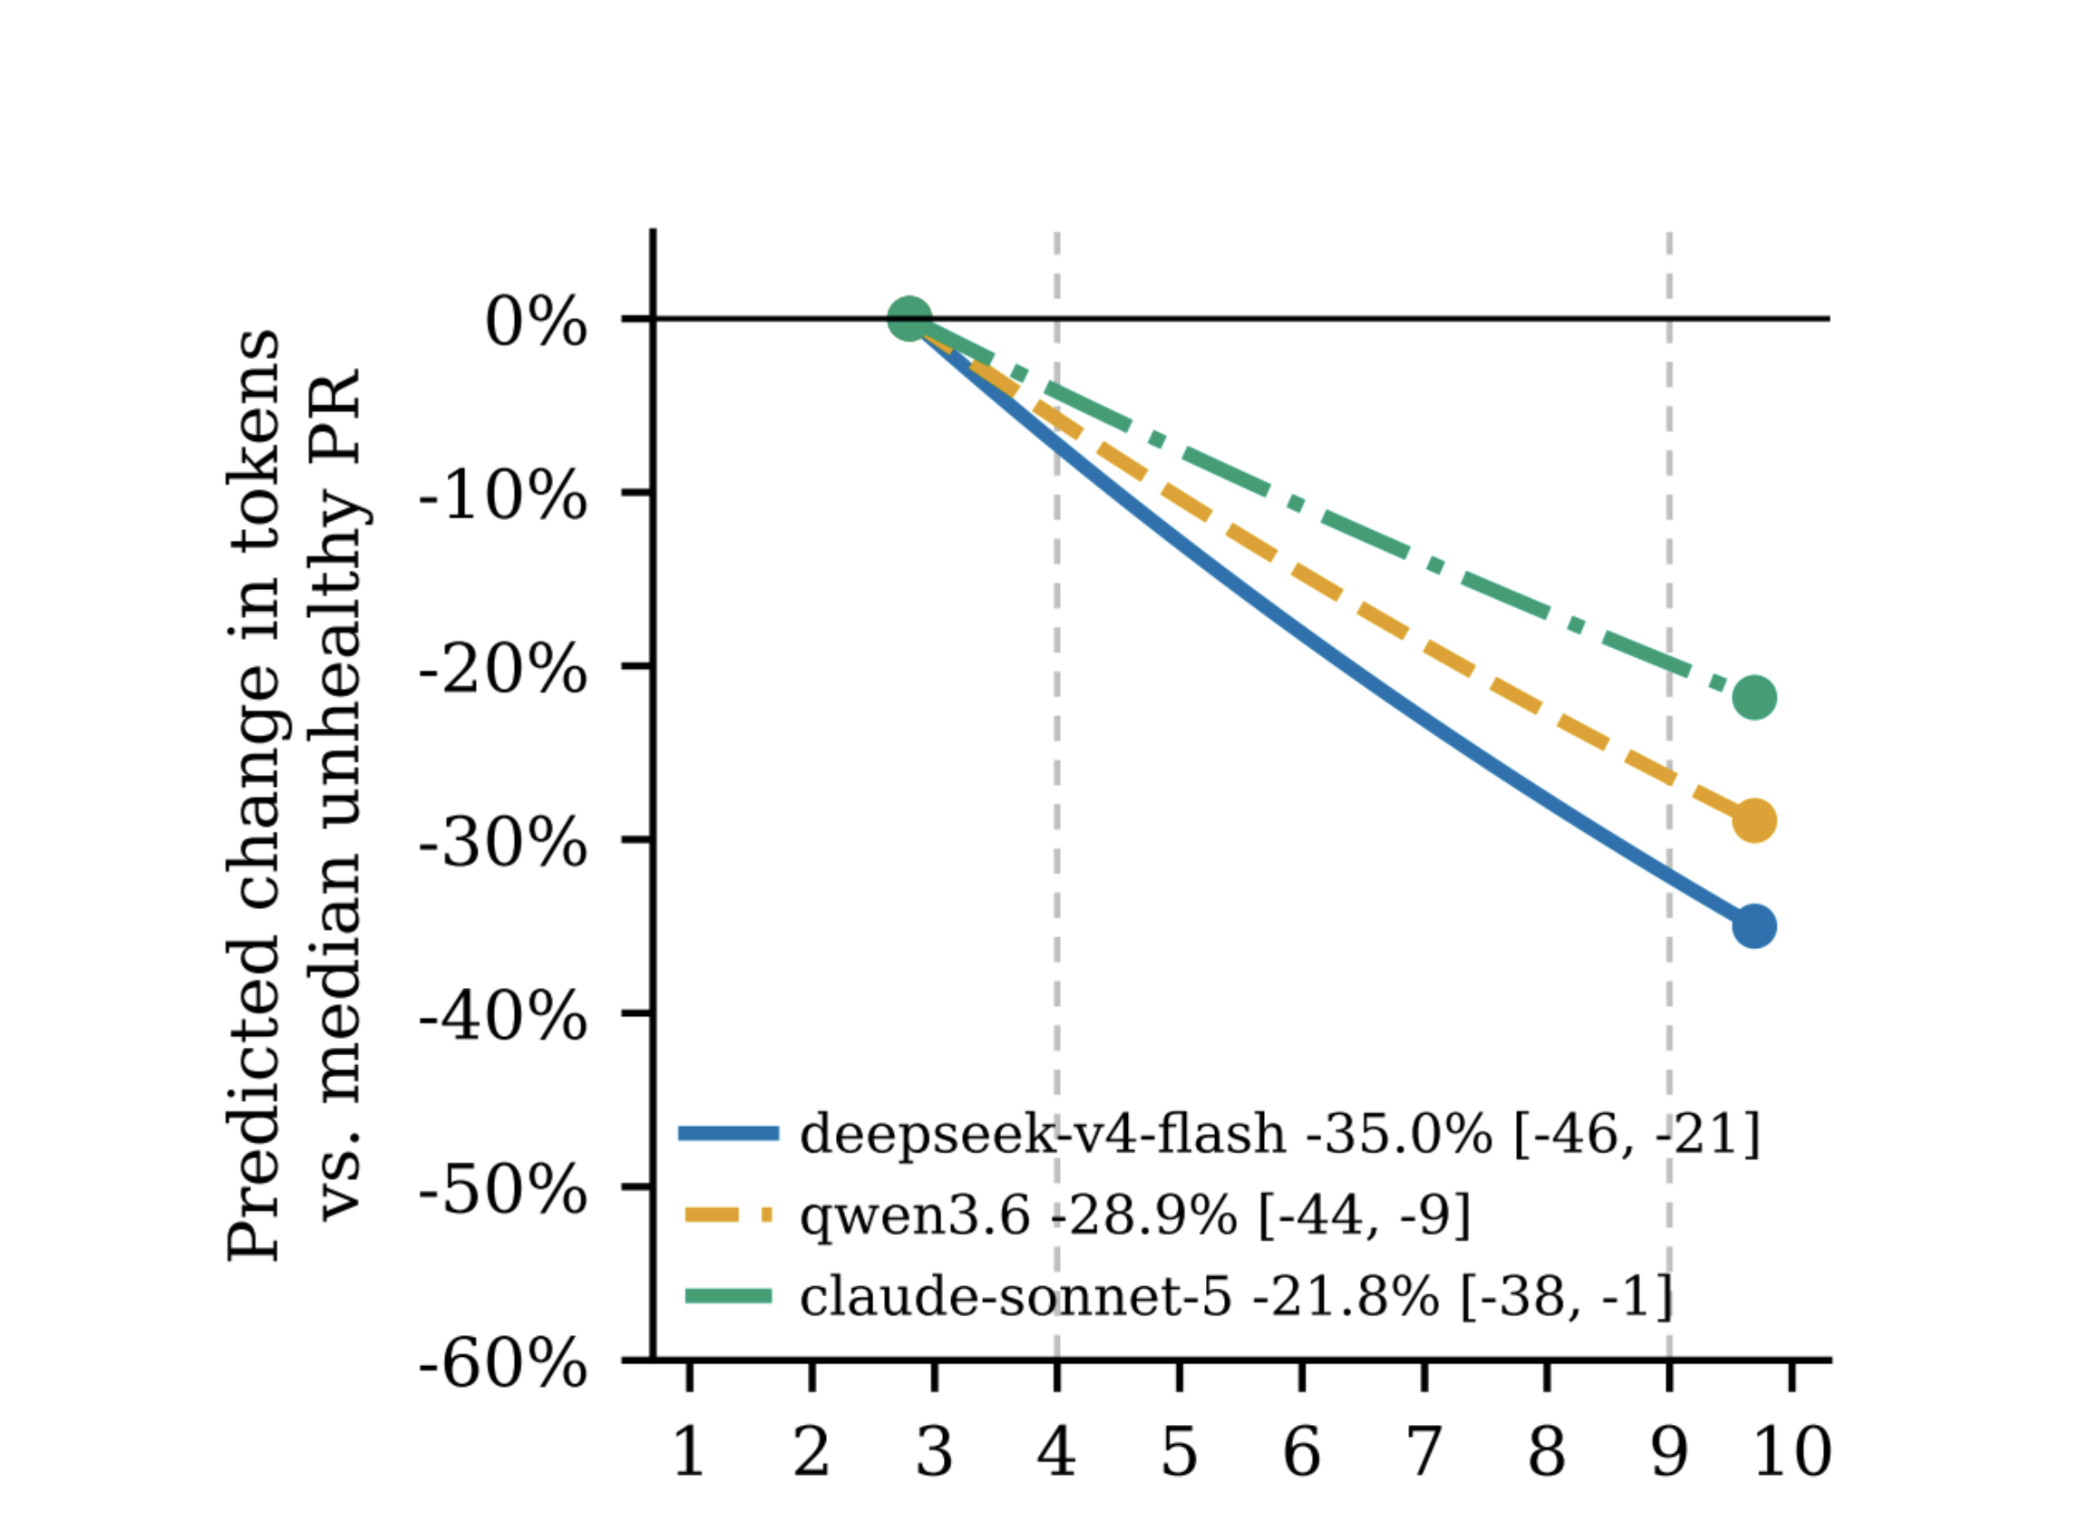
Token cost falls with CH for all three LLMs, and CH does not predict footprint, so larger PR footprints do not account for the extra cost of unhealthy code. *CH=CodeHealth
Where the tokens go: reading unhealthy code takes longer
The review stage accounts for a median of 84.7, 86.2 and 85.8% of the tokens per pull request, and the Code Health association concentrates there. Three exploratory results (corrected for multiple testing) show what happens inside it:
- Longer reviews: on unhealthy code, the review agents take more iterations and retrieve more context.
- Same number of findings: the number of review comments produced by the agent is unrelated to the Code Health score. The comment count follows the number of code smells in the files. Doubling the smell count goes with 10 to 19% more findings (10.3, 15.7 and 18.8% across the three LLMs).
- Costlier findings: one Code Health point goes with 5.0 to 7.6% lower review cost per finding. Across the 6.9-point contrast, a healthy pull request costs 30 to 42% less per finding.
The agents write about as many comments on healthy code as on unhealthy code. Reaching them costs more on the unhealthy side.
Three pull requests, side by side
To make this concrete, we followed one pull request from each Code Health tier through the pipeline. All three are medium-sized and were reviewed with claude-sonnet-5.
| Tier | Code Health | Changed lines | Files changed |
Review comments |
Review iterations |
Total tokens |
| Healthy | 9.02 | 106 | 3 | 9 | 13 | 325,612 |
| Problematic | 7.08 | 114 | 9 | 5 | 16 | 495,453 |
| Unhealthy | 2.77 | 108 | 15 | 2 | 27 | 715,716 |
The unhealthy pull request cost 2.2 times as many tokens as the healthy one (715,716 divided by 325,612) for a similar line count, and drew 2 review comments to the healthy one's 9. Each is the pull request closest to its tier's median among those with 95 to 125 changed lines. Obviously, three pull requests are only an illustration, and we treat them that way in the paper. The evidence originates in the 465-pull-request regression.
Which smells cost the most?
We named three particularly interesting code smells in advance as likely cost drivers. Two held up. Complex Method and Complex Conditional predicted fix-stage tokens for all three LLMs. Code Duplication predicted nothing, and for claude-sonnet-5 the sign even reversed. We report that as a failed prediction. If you’re deciding on what code smells to refactor first, the data points to tangled control flow.
One batch fix pass leaves the score where it was
After the review agents finished, the fix agent applied all their comments in a single pass. The median change in Code Health was zero for every LLM and every tier. The score stayed the same for 44.4 to 49.0% of the pull requests. Among those that moved, drops outnumbered gains for all three LLMs (158 to 94 for deepseek-v4-flash, for example). This shows how fixing review comments is not the same as refactoring for maintainability: if you want healthier code, you have to plan for it.
What to do if you run engineering
If you are a CTO or Head of Engineering, here is our opinion, built on the data and the recommendations in our paper.
- Put CodeHealth next to token spend: A dashboard with token totals alone cannot tell you why one pull request cost far more than another. The health of the files it touches helps explain why. The code is part of the context that coding agents operate in.
- Gate the files agents touch most: Our paper suggests a quality gate on incoming changes, similar to a coverage gate. A change that lowers the Code Health of the files it touches waits until the score is brought back up. The metric is deterministic static analysis, so it is cheap to run on every change. We argue for a gate set at an agreed target, since the returns on maintainability grow toward the healthy end.
- Plan refactoring as its own work: One batch fix pass left the median score untouched, so the debt stays until someone pays it down on purpose. The data supports refactoring that splits long methods and shrinks files, delivered as separate, reviewable commits with test coverage behind them.
- Keep pull requests small as well: Size is still the strongest driver of cost. Pull both levers.
Our opinion is blunt: an AI cost model without Code Health leaves out a driver that the study found.
Summary
Agents pay for the code they read, and healthy code is cheaper to review. In 465 pull requests and three LLMs, each Code Health point went with 3.5 to 6.1% fewer tokens, and pull request size did not account for it.
This fits two earlier studies. In LLM-based unit-test generation, files with lower Code Health required more input tokens, for Java and C++ even after accounting for file size (arXiv 2608.18645). And in our FORGE 2026 study of 5,000 Python files, LLMs broke tests significantly less often when refactoring healthy code, with relative risk reductions of 15 to 30% (see arXiv 2601.02200). Different tasks but the direction was the same: agents work more efficiently and reliably in healthy code.
Next step for CTOs and Heads of Engineering: Implement safeguarding in your agentic workflow, read more about our CodeHealth MCP.
FAQ
Does code quality affect AI token costs?
Yes, in this study. Each CodeHealth point went with 3.5 to 6.1% fewer tokens for agentic review and fix across three LLMs, in 465 agent-authored pull requests. The study is observational, so it reports an association.
How much cheaper is healthy code for AI agents to review?
Between a typical unhealthy pull request (Code Health 2.8) and a typical healthy one (9.7), the study estimates 21.8 to 35.0% fewer tokens, depending on the LLM.
Do unhealthy pull requests cost more because they are bigger?
Pull request size is a separate driver of cost. Code Health was unrelated to pull request size in this sample, so the extra cost on unhealthy code is a second effect.
What is CodeHealth?
CodeScene's code quality metric: a score from 1 to 10 built from code smells such as complex methods, deeply nested conditionals and duplicated logic. Unhealthy code scores below 4, and healthy code scores 9 and above. AI requires even higher code quality, at least 9.5 on our scale of 10.0. Read our previous research.
Which code smells drive the cost?
Complex Method and Complex Conditional predicted fix-stage cost for all three LLMs. Code Duplication did not.
What are the limits of the study?
It is observational, so it shows an association. It cannot show cause. It covers agent-authored pull requests in open source projects. In the data, unhealthy code appeared in much longer files, and the paper argues that file size is part of how CodeHealth translates into token cost.
Where can I read the study?
The paper is on arXiv (2610.21914) and the data is on Zenodo.