Bad code tends to stick.
Not only does it stay where it is; It stays there for years often outliving its original programmers, in the organizational sense, and to the displeasure of the next generation of programmers responsible for its maintenance. Making changes to such code is a high risk activity.
Given the scale of today’s codebases, we need more efficient tools to identify those parts of the system so that we can apply corrective actions, invest extra testing efforts, or focus code reviews. In this article we show how CodeScene prioritizes technical debt to ensure that the suggested improvements give you a real return on your investment.
The Challenges of Tech Debt at Scale
Today’s software systems consists of hundreds of thousands, often million lines of code. The scale of such systems make them virtually impossible to reason about; There are few people in the world who can keep a million lines of code in their head. Modern codebases are also built on several different technologies. As if this technical variety isn’t complex enough, large-scale systems are also developed by multiple programmers organized into different teams. Each individual programmer is only exposed to a small part of the codebase, and frequently no one has a holistic picture.
Our main challenges, if we want to understand and improve a codebase, is to balance these technical and organizational challenges. Unfortunately, as evident by sources like the CHAOS report - the majority of all projects fail to deliver on time or on budget - this is where organizations fail. I think there’s a simple explanation for this repeated failure of our industry: The reason it’s so hard to prioritize improvements is because most of the time we make our decisions based on what we see: the system as it looks today, its source code. But I will claim that the source code in isolation is incomplete information. Let’s see how we can use a concept called behavioral code analysis to help us out.

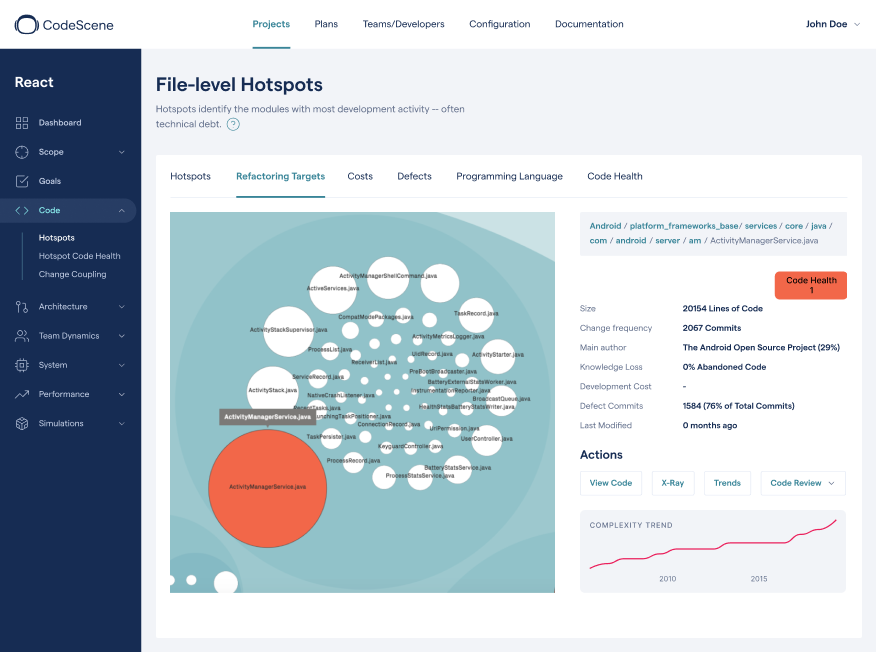
An example on automatically prioritized technical debt in Android.
Use Behavioral Code Analysis to Prioritize Technical Debt
How do you know where to start to reduce technical debt? CodeScene identifies and prioritizes tech debt based on how the organization works with the code. That is, we look at patterns in how the developers interact with the codebase, and we detect in which direction each piece of code evolves – does it get better or worse? The reason we’re able to do that is because we collect and analyze behavioral data as recorded in version-control systems:
The best thing with this approach is that virtually all software organizations already have the data they need - we’re just not used to think about version-control in that way – a version-control system is basically a behavioral log of how each developer has interacted with the code.
Towards an Evolutionary View of Software
Behavioral code analysis builds on a powerful pattern that we see recur over and over again, independent of programming language or technology. So have a look at the graph in the following figure. The X-axis shows each file in the system sorted on their change frequencies. The Y-axis shows the number of changes done to each file over time.
The distributions above show that most of our development activity is located in a relatively small part of the total codebase. The majority of all files are in the long tail, which means they represent code that’s rarely, if ever, touched. And this is a pattern that occurs in all codebases we have seen so far, independent of domain, size, or age.
This change distribution of code has several interesting implications. First of all, it gives us a tool to prioritize improvements and refactorings. Refactoring complex code is both a high-risk activity and expensive. Using our knowledge of how code evolves, we’re able to focus on the parts where we’re likely to get a return on that investment. That is, any improvements we make to the files in the red area (highlighted in the preceding illustration) have a high likelihood of providing productivity gains since those files represent code we need to work with all the time.
Armed with this knowledge we have one key component to prioritize technical debt. However, the model still suffers a weakness. Why, because all code isn’t equal. For example, it’s a huge difference to increase a simple version number in a single-line file compared to correcting a bug in a file with 5.000 lines of C++ with tricky, nested conditional logic. The first change is low risk and can for all practical purposes be ignored while the second type of change needs extra attention in terms of test and code inspections. Thus, we need to add a second dimension to our model in order to improve its predictive power; We need to add a complexity dimension. Let’s see how that’s done.
Use Code Health Trends to Identify Expensive Hotspots
We use CodeScene ourselves internally as part of our services. Over the past years we have analyzed hundreds of different codebases, and there are some patterns that we have seen repeated over and over again. Thus, we implemented support in CodeScene for auto-detecting those patterns, and we call these features code biomarkers and code health. We chose that name because we wanted to avoid terms like “quality” or “maintenance effort” since they suggest an absolute truth, and there’s no such thing as an absolute truth in software design. Context matters.
In medicine, a biomarker is a measure that might indicate a particular disease or physiological state of an organism. CodeScene’s biomarkers do the same for code to detect healthy and unhealthy code. Combined with our trend measures, you get a high-level summary of the state of your hotspots and the direction your code is moving in:
CodeScene's Code Health trends show the status of your hotspots at a glance.
The Code Health metric is a score that goes from 10 (healthy code that’s relatively easy to understand and evolve) down to 1, which indicates code with severe quality issues. This gives you a direct way to identify hotspots, which are complicated code that you – as an organization – have to work with often.
Narrow the Technical Debt with Machine Learning on Code
Under the hood, CodeScene employs machine learning algorithms that look at deeper patterns in the analysis data, like potential coordination problems on an organizational level, coupling to other entities, code that decays, excess developer fragmentation, and much more.
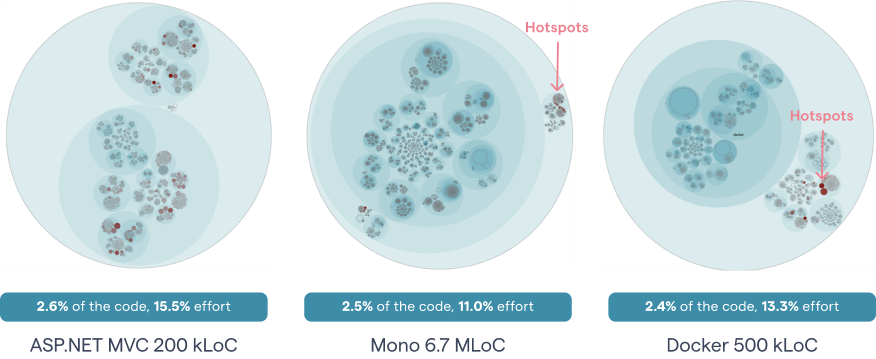
The following illustration shows how this algorithm manages to narrow down the amount of Hotspots to a small part of the total code size when run on a number of open-source projects:

As you see in the picture above, the prioritized Hotspots only make up 2-3% of the total code size. Yet there’s a disproportional amount of development activity in that small part with 11-16% of all commits touching those Hotspots. This means that code improvements to a prioritized Hotspot is time well-invested.
Know how to use Hotspots
A Hotspots analysis has several use cases and serves multiple audiences:
- Use hotspots to prioritize technical debt and maintenance problems. Complicated code that we have to work with often is no fun. Use the hotspot information to prioritize re-designs and strategic refactorings.
- Technical leaders use hotspots for risk management. Making a change to a Hotspot or extending its functionality with new features might come with increased high risk. A Hotspot analysis lets you identify those areas so that you can schedule additional time or allocate extra testing efforts.
- Hotspots are input to exploratory tests. A Hotspot Map is an excellent way for a skilled tester to identify parts of the codebase that seem unstable with lots of development activity. Use that information to select your starting points and focus areas for exploratory tests.
Finally, I’d like to point out that there’s a strong correlation between the top Hotspots and the most defect dense parts in a codebase. In our research, the top Hotspots only make up a minor part of the code, yet that code is responsible for 25-70% of all reported and resolved defects. Using behavioral code analysis, you can detect those areas in the code and act upon them. Use that information to your advantage.
Explore More and try CodeScene
CodeScene’s analyses are completely automated, and the tool is available both for on-prem and cloud. You can also find interesting benchmark studie in our Research section. Start a free trial and make sure to reach out to us if you have any questions.